50. Auburn, WA
-
Average one-way commute time to work: 31.7 minutes (20.1% higher than national average)
-
Driving alone in car, truck, or van: 28.5 minutes
-
Carpool: 33.5 minutes
-
Public transportation: 63.4 minutes
-
Workers with one-way commutes over 60 minutes: 14.9% (6.0% more than the national average)
-
Driving alone in car, truck, or van: 9.9%
-
Carpool: 19.1%
-
Public transportation: 59%
-
Workers 16 years and over: 35,617
-
Workers who drove a car, truck, or van: 26,806
-
Workers carpooling: 3,790
-
Workers taking public transportation: 2,432
-
Workers who commute outside their county of residence: 20.9%
-
Workers who commute outside their state of residence: 0.5%
Unexpected vet bills don’t have to break the bank

Life with pets is unpredictable, but there are ways to prepare for the unexpected.
Fetch Insurance offers coverage for treatment of accidents, illnesses, prescriptions drugs, emergency care and more.
Plus, their optional wellness plan covers things like routine vet trips, grooming and training costs, if you want to give your pet the all-star treatment while you protect your bank account.
Get A Quote49. Alexandria, VA
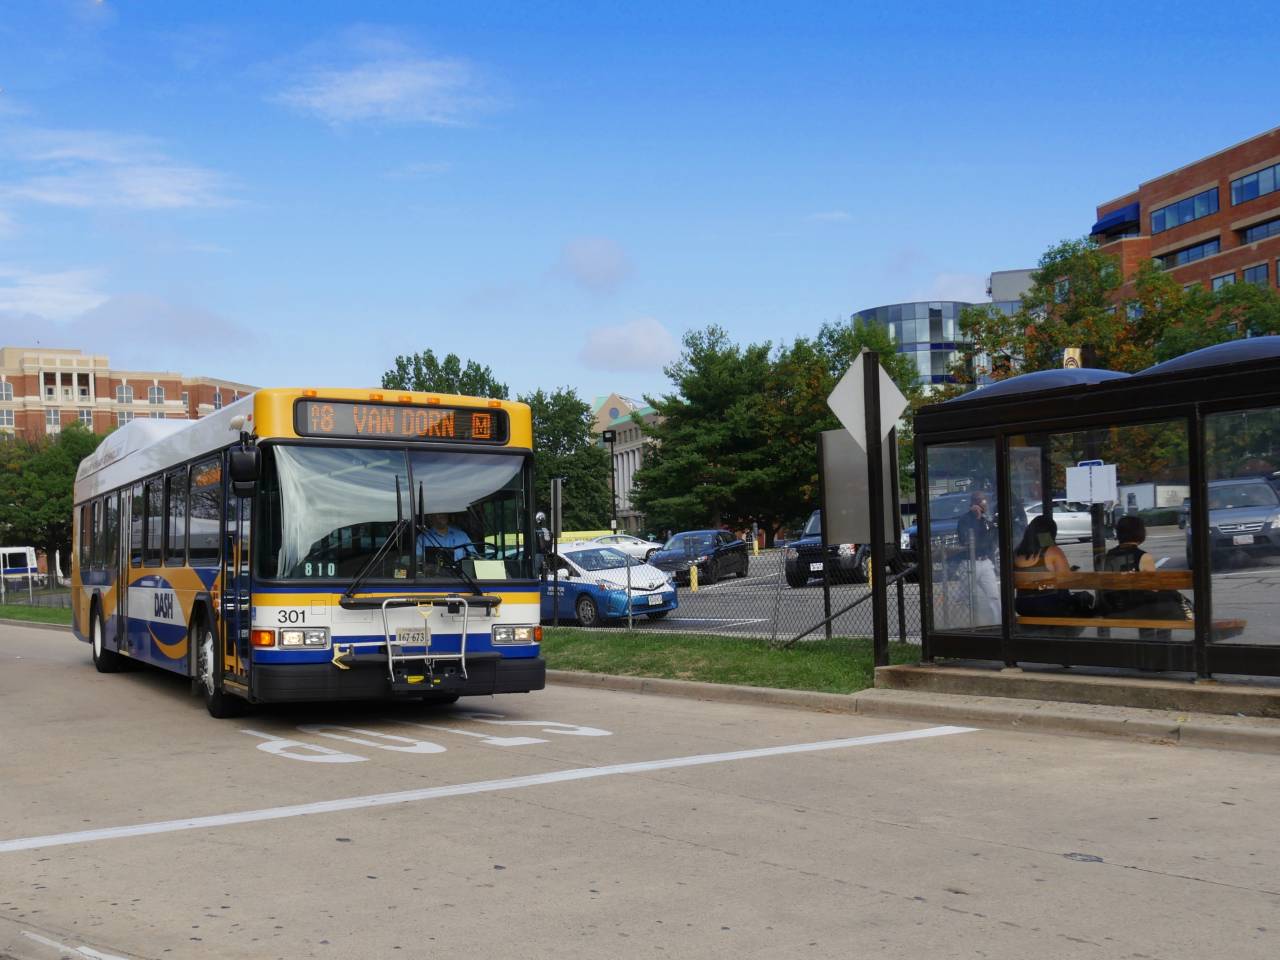
-
Average one-way commute time to work: 31.8 minutes (20.5% higher than national average)
-
Driving alone in car, truck, or van: 27.6 minutes
-
Carpool: 31.2 minutes
-
Public transportation: 44.4 minutes
-
Workers with one-way commutes over 60 minutes: 10.8% (1.9% more than the national average)
-
Driving alone in car, truck, or van: 5.9%
-
Carpool: 11.3%
-
Public transportation: 23.8%
-
Workers 16 years and over: 96,381
-
Workers who drove a car, truck, or van: 56,079
-
Workers carpooling: 8,044
-
Workers taking public transportation: 21,100
-
Workers who commute outside their county of residence: 36.2%
-
Workers who commute outside their state of residence: 36.7%
48. South Gate, CA
-
Average one-way commute time to work: 31.8 minutes (20.5% higher than national average)
-
Driving alone in car, truck, or van: 29.9 minutes
-
Carpool: 33.4 minutes
-
Public transportation: 50.5 minutes
-
Workers with one-way commutes over 60 minutes: 14.8% (5.9% more than the national average)
-
Driving alone in car, truck, or van: 11.7%
-
Carpool: 16%
-
Public transportation: 43.1%
-
Workers 16 years and over: 40,753
-
Workers who drove a car, truck, or van: 28,544
-
Workers carpooling: 6,408
-
Workers taking public transportation: 2,875
-
Workers who commute outside their county of residence: 6.9%
-
Workers who commute outside their state of residence: 0.2%
47. Rancho Cucamonga, CA
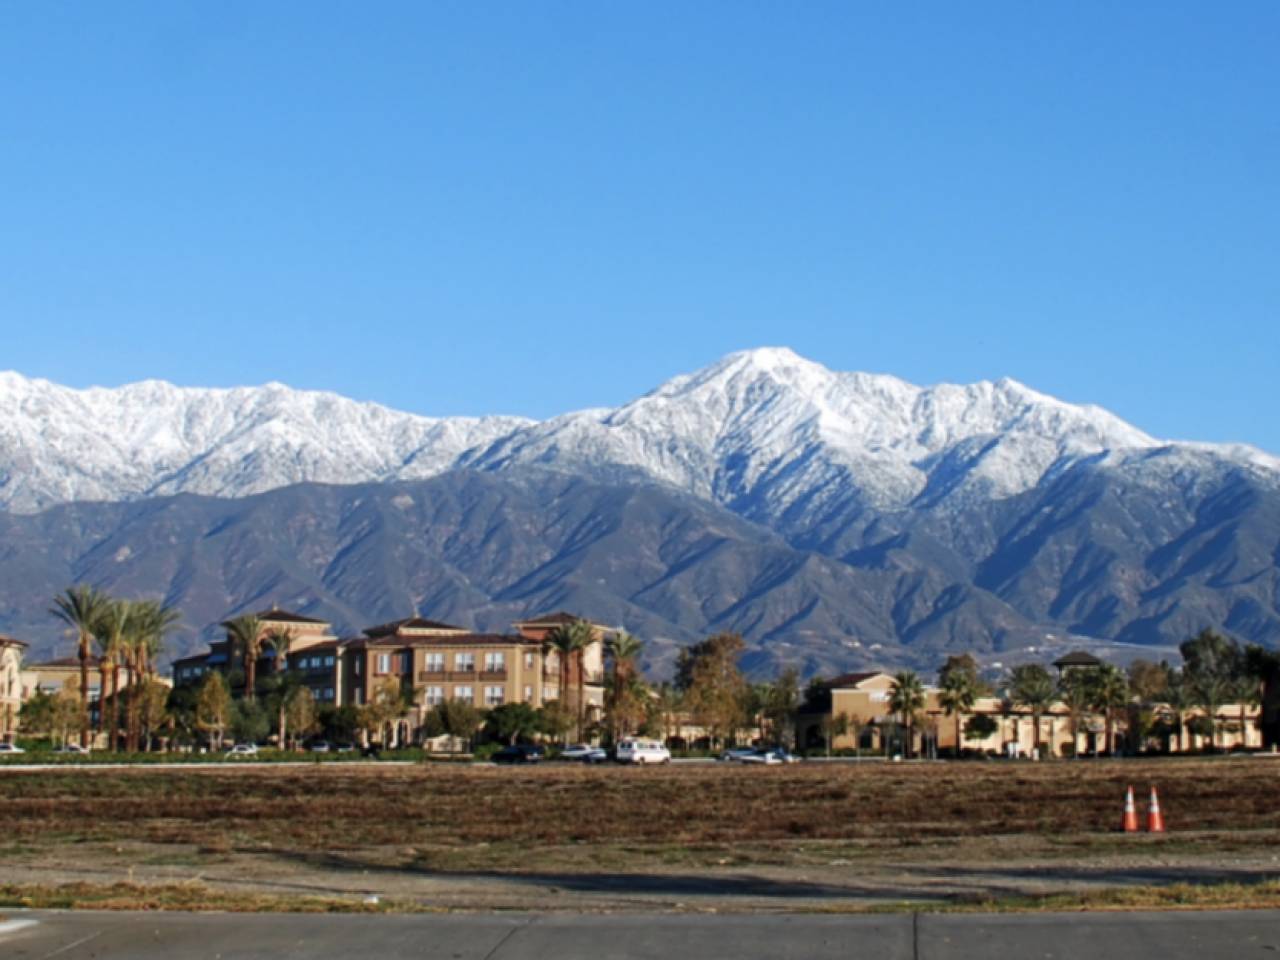
-
Average one-way commute time to work: 31.8 minutes (20.5% higher than national average)
-
Driving alone in car, truck, or van: 30.4 minutes
-
Carpool: 36.3 minutes
-
Public transportation: 75.8 minutes
-
Workers with one-way commutes over 60 minutes: 15.9% (7.0% more than the national average)
-
Driving alone in car, truck, or van: 13.8%
-
Carpool: 22.8%
-
Public transportation: 79.8%
-
Workers 16 years and over: 82,302
-
Workers who drove a car, truck, or van: 66,682
-
Workers carpooling: 8,339
-
Workers taking public transportation: 1,330
-
Workers who commute outside their county of residence: 37.4%
-
Workers who commute outside their state of residence: 0.5%
46. Oakland, CA

-
Average one-way commute time to work: 31.9 minutes (20.8% higher than national average)
-
Driving alone in car, truck, or van: 27.3 minutes
-
Carpool: 30.7 minutes
-
Public transportation: 46.9 minutes
-
Workers with one-way commutes over 60 minutes: 14.5% (5.6% more than the national average)
-
Driving alone in car, truck, or van: 9.8%
-
Carpool: 12.1%
-
Public transportation: 30.2%
-
Workers 16 years and over: 206,680
-
Workers who drove a car, truck, or van: 106,317
-
Workers carpooling: 24,013
-
Workers taking public transportation: 44,107
-
Workers who commute outside their county of residence: 35.2%
-
Workers who commute outside their state of residence: 0.3%
45. Frederick, MD

-
Average one-way commute time to work: 31.9 minutes (20.8% higher than national average)
-
Driving alone in car, truck, or van: 30.3 minutes
-
Carpool: 32.4 minutes
-
Public transportation: 78.3 minutes
-
Workers with one-way commutes over 60 minutes: 21.2% (12.3% more than the national average)
-
Driving alone in car, truck, or van: 19.9%
-
Carpool: 21.5%
-
Public transportation: 66.6%
-
Workers 16 years and over: 36,989
-
Workers who drove a car, truck, or van: 27,408
-
Workers carpooling: 4,280
-
Workers taking public transportation: 1,666
-
Workers who commute outside their county of residence: 25%
-
Workers who commute outside their state of residence: 9.9%
44. Rockville, MD

-
Average one-way commute time to work: 32 minutes (21.2% higher than national average)
-
Driving alone in car, truck, or van: 27.2 minutes
-
Carpool: 36.6 minutes
-
Public transportation: 49.5 minutes
-
Workers with one-way commutes over 60 minutes: 15.3% (6.4% more than the national average)
-
Driving alone in car, truck, or van: 9%
-
Carpool: 19.9%
-
Public transportation: 37.4%
-
Workers 16 years and over: 35,352
-
Workers who drove a car, truck, or van: 22,554
-
Workers carpooling: 2,988
-
Workers taking public transportation: 6,355
-
Workers who commute outside their county of residence: 6.6%
-
Workers who commute outside their state of residence: 24.9%
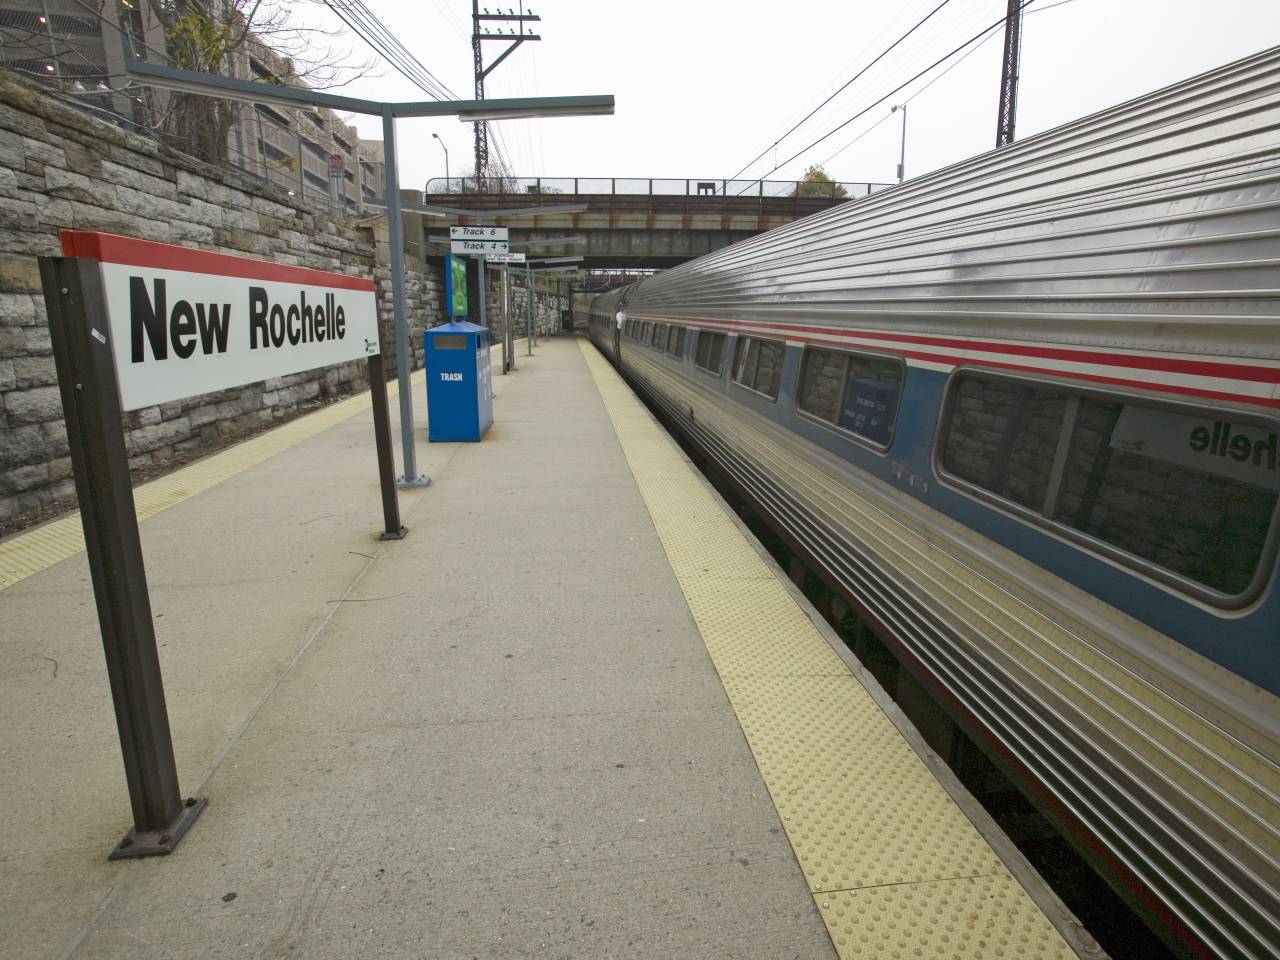
43. New Rochelle, NY
-
Average one-way commute time to work: 32.1 minutes (21.6% higher than national average)
-
Driving alone in car, truck, or van: 25.4 minutes
-
Carpool: 26.2 minutes
-
Public transportation: 55.8 minutes
-
Workers with one-way commutes over 60 minutes: 18.5% (9.6% more than the national average)
-
Driving alone in car, truck, or van: 7.8%
-
Carpool: 9.8%
-
Public transportation: 52.1%
-
Workers 16 years and over: 38,520
-
Workers who drove a car, truck, or van: 20,665
-
Workers carpooling: 3,455
-
Workers taking public transportation: 9,047
-
Workers who commute outside their county of residence: 34.3%
-
Workers who commute outside their state of residence: 4.9%
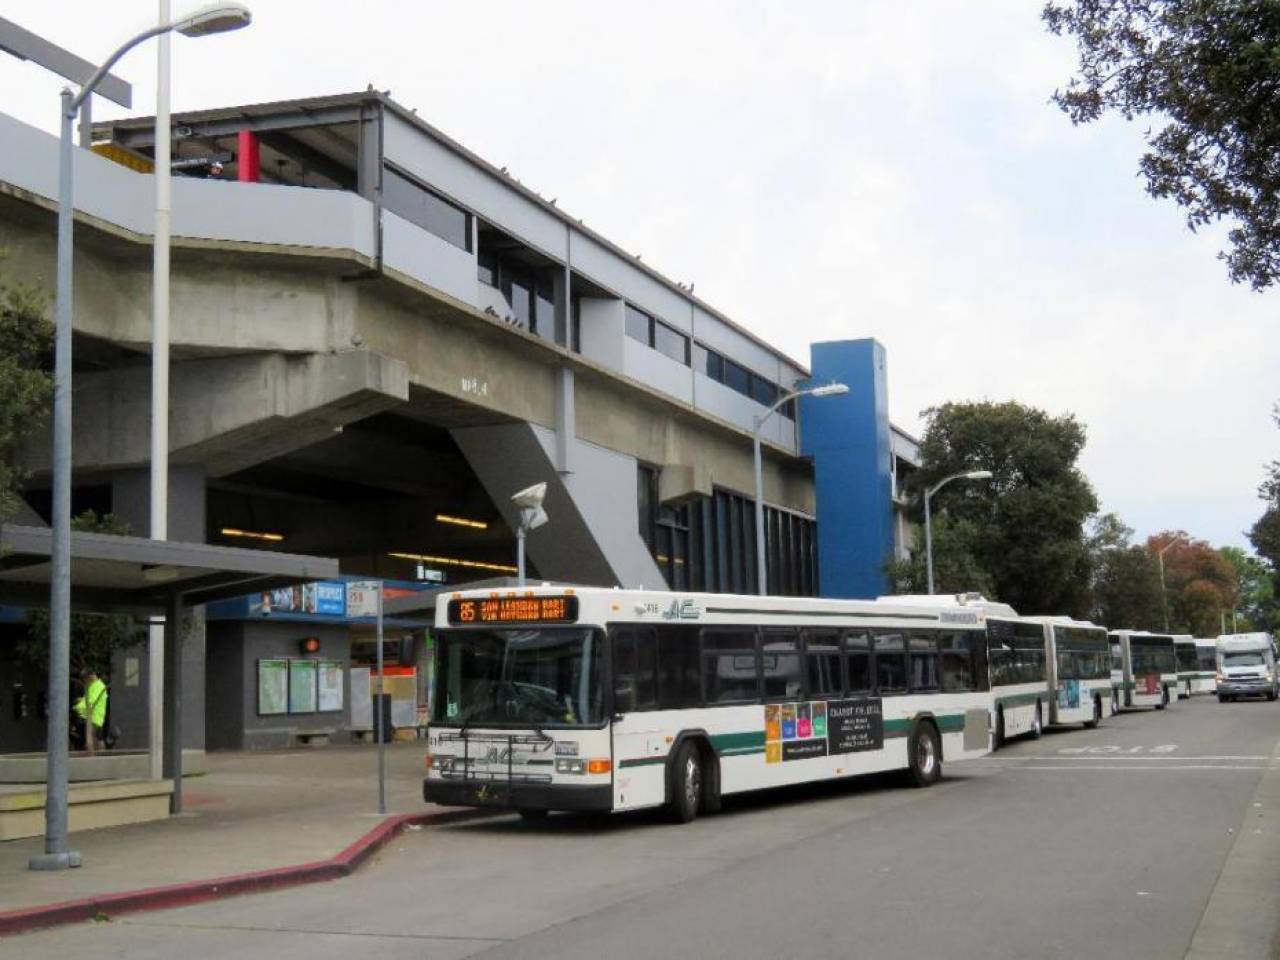
42. San Leandro, CA
-
Average one-way commute time to work: 32.4 minutes (22.7% higher than national average)
-
Driving alone in car, truck, or van: 29.1 minutes
-
Carpool: 31.4 minutes
-
Public transportation: 52.2 minutes
-
Workers with one-way commutes over 60 minutes: 15.4% (6.5% more than the national average)
-
Driving alone in car, truck, or van: 10.6%
-
Carpool: 15.3%
-
Public transportation: 41.9%
-
Workers 16 years and over: 43,595
-
Workers who drove a car, truck, or van: 30,388
-
Workers carpooling: 4,440
-
Workers taking public transportation: 5,524
-
Workers who commute outside their county of residence: 28.8%
-
Workers who commute outside their state of residence: 0.2%
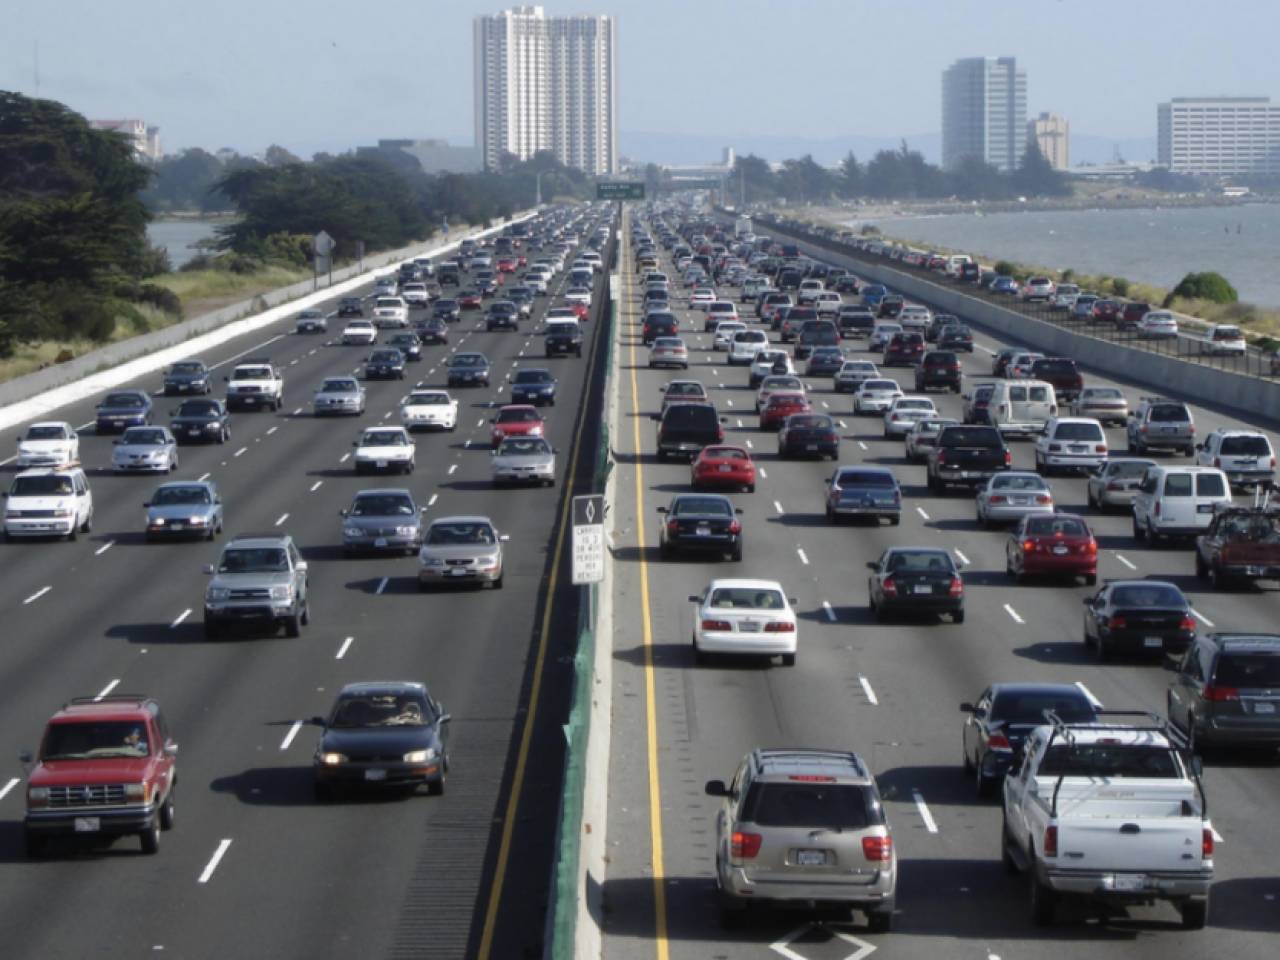
41. Hayward, CA
-
Average one-way commute time to work: 32.4 minutes (22.7% higher than national average)
-
Driving alone in car, truck, or van: 30 minutes
-
Carpool: 33.7 minutes
-
Public transportation: 52.7 minutes
-
Workers with one-way commutes over 60 minutes: 15.5% (6.6% more than the national average)
-
Driving alone in car, truck, or van: 11%
-
Carpool: 18.2%
-
Public transportation: 48%
-
Workers 16 years and over: 72,302
-
Workers who drove a car, truck, or van: 51,327
-
Workers carpooling: 8,647
-
Workers taking public transportation: 6,890
-
Workers who commute outside their county of residence: 34.2%
-
Workers who commute outside their state of residence: 0.1%
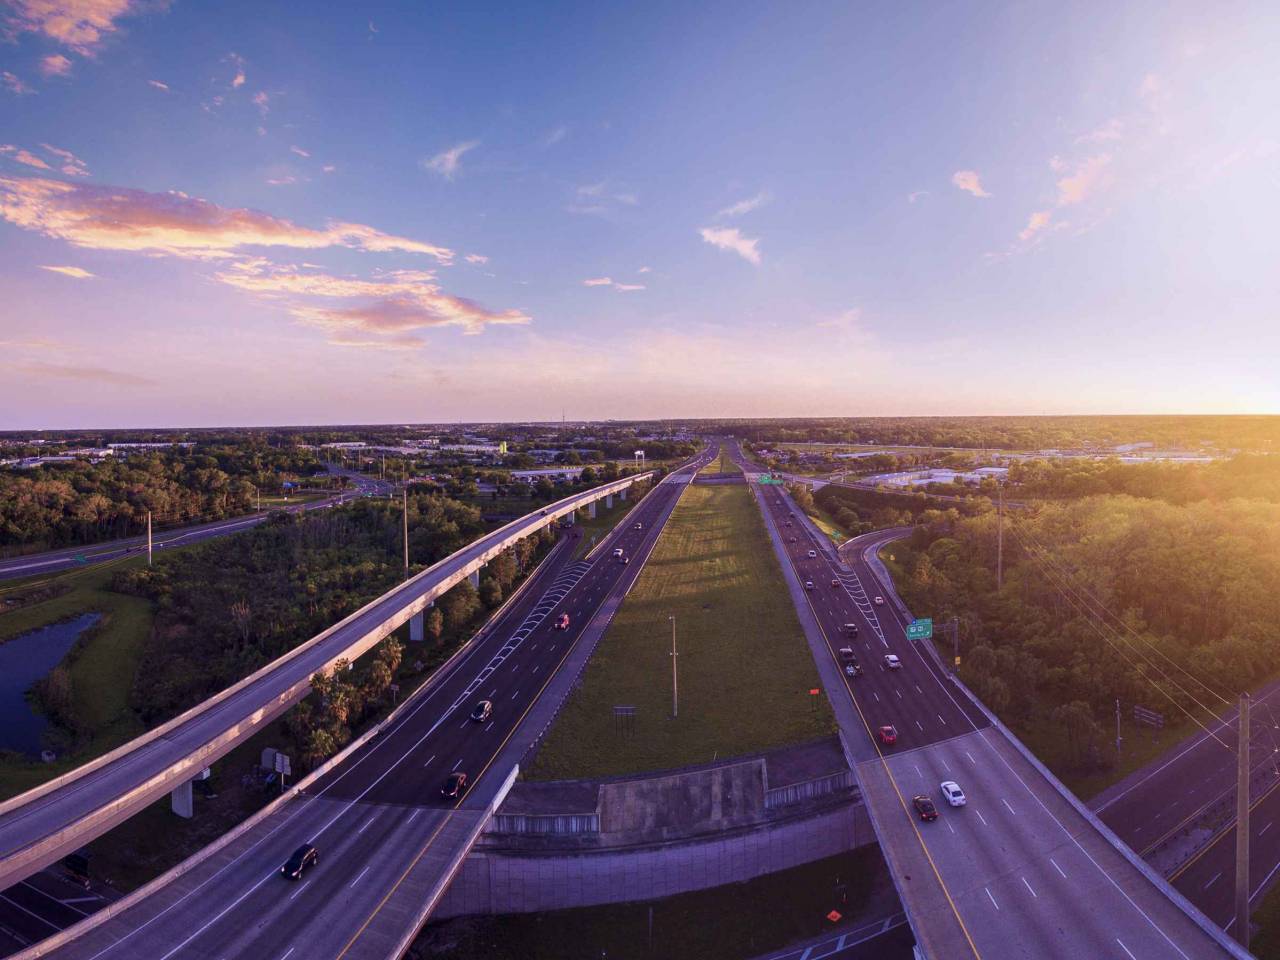
40. Deltona, FL
-
Average one-way commute time to work: 32.5 minutes (23.1% higher than national average)
-
Driving alone in car, truck, or van: 32.3 minutes
-
Carpool: 35 minutes
-
Public transportation: 50.8 minutes
-
Workers with one-way commutes over 60 minutes: 12.2% (3.3% more than the national average)
-
Driving alone in car, truck, or van: 11.6%
-
Carpool: 18.6%
-
Public transportation: 60.2%
-
Workers 16 years and over: 36,299
-
Workers who drove a car, truck, or van: 31,524
-
Workers carpooling: 2,843
-
Workers taking public transportation: 123
-
Workers who commute outside their county of residence: 46%
-
Workers who commute outside their state of residence: 0.6%
39. Kendall, FL
-
Average one-way commute time to work: 32.5 minutes (23.1% higher than national average)
-
Driving alone in car, truck, or van: 32.1 minutes
-
Carpool: 29.1 minutes
-
Public transportation: 49.5 minutes
-
Workers with one-way commutes over 60 minutes: 14.6% (5.7% more than the national average)
-
Driving alone in car, truck, or van: 14.2%
-
Carpool: 9.5%
-
Public transportation: 27.9%
-
Workers 16 years and over: 38,247
-
Workers who drove a car, truck, or van: 31,775
-
Workers carpooling: 2,507
-
Workers taking public transportation: 1,537
-
Workers who commute outside their county of residence: 3.9%
-
Workers who commute outside their state of residence: 0.4%
38. Whittier, CA
-
Average one-way commute time to work: 32.7 minutes (23.9% higher than national average)
-
Driving alone in car, truck, or van: 31.9 minutes
-
Carpool: 36.1 minutes
-
Public transportation: 63.7 minutes
-
Workers with one-way commutes over 60 minutes: 15.1% (6.2% more than the national average)
-
Driving alone in car, truck, or van: 13.4%
-
Carpool: 22.1%
-
Public transportation: 58.4%
-
Workers 16 years and over: 40,098
-
Workers who drove a car, truck, or van: 32,695
-
Workers carpooling: 3,705
-
Workers taking public transportation: 906
-
Workers who commute outside their county of residence: 18.6%
-
Workers who commute outside their state of residence: 0.2%
37. San Francisco, CA

-
Average one-way commute time to work: 32.8 minutes (24.2% higher than national average)
-
Driving alone in car, truck, or van: 30.5 minutes
-
Carpool: 30.1 minutes
-
Public transportation: 41.6 minutes
-
Workers with one-way commutes over 60 minutes: 14.2% (5.3% more than the national average)
-
Driving alone in car, truck, or van: 11%
-
Carpool: 10%
-
Public transportation: 23.8%
-
Workers 16 years and over: 495,315
-
Workers who drove a car, truck, or van: 170,042
-
Workers carpooling: 33,747
-
Workers taking public transportation: 168,514
-
Workers who commute outside their county of residence: 23.7%
-
Workers who commute outside their state of residence: 0.4%
36. Philadelphia, PA

-
Average one-way commute time to work: 32.9 minutes (24.6% higher than national average)
-
Driving alone in car, truck, or van: 30.5 minutes
-
Carpool: 33.4 minutes
-
Public transportation: 44.5 minutes
-
Workers with one-way commutes over 60 minutes: 14.3% (5.4% more than the national average)
-
Driving alone in car, truck, or van: 9.7%
-
Carpool: 14.7%
-
Public transportation: 28.9%
-
Workers 16 years and over: 649,574
-
Workers who drove a car, truck, or van: 331,271
-
Workers carpooling: 54,786
-
Workers taking public transportation: 164,181
-
Workers who commute outside their county of residence: 19.1%
-
Workers who commute outside their state of residence: 5.6%
35. Union City, NJ
-
Average one-way commute time to work: 33 minutes (25.0% higher than national average)
-
Driving alone in car, truck, or van: 29.1 minutes
-
Carpool: 32.9 minutes
-
Public transportation: 41 minutes
-
Workers with one-way commutes over 60 minutes: 16.2% (7.3% more than the national average)
-
Driving alone in car, truck, or van: 8.9%
-
Carpool: 16.1%
-
Public transportation: 25.4%
-
Workers 16 years and over: 35,198
-
Workers who drove a car, truck, or van: 10,091
-
Workers carpooling: 4,435
-
Workers taking public transportation: 15,116
-
Workers who commute outside their county of residence: 25.7%
-
Workers who commute outside their state of residence: 20.5%
34. Alameda, CA

-
Average one-way commute time to work: 33 minutes (25.0% higher than national average)
-
Driving alone in car, truck, or van: 28.7 minutes
-
Carpool: 29.5 minutes
-
Public transportation: 51.5 minutes
-
Workers with one-way commutes over 60 minutes: 16.5% (7.6% more than the national average)
-
Driving alone in car, truck, or van: 10.8%
-
Carpool: 11.5%
-
Public transportation: 38.8%
-
Workers 16 years and over: 40,199
-
Workers who drove a car, truck, or van: 23,892
-
Workers carpooling: 3,439
-
Workers taking public transportation: 7,139
-
Workers who commute outside their county of residence: 34.4%
-
Workers who commute outside their state of residence: 0.7%
33. Fontana, CA
-
Average one-way commute time to work: 33 minutes (25.0% higher than national average)
-
Driving alone in car, truck, or van: 30.9 minutes
-
Carpool: 40.9 minutes
-
Public transportation: 76.3 minutes
-
Workers with one-way commutes over 60 minutes: 17.3% (8.4% more than the national average)
-
Driving alone in car, truck, or van: 14.3%
-
Carpool: 28.1%
-
Public transportation: 71.4%
-
Workers 16 years and over: 91,390
-
Workers who drove a car, truck, or van: 71,719
-
Workers carpooling: 12,291
-
Workers taking public transportation: 1,676
-
Workers who commute outside their county of residence: 32.5%
-
Workers who commute outside their state of residence: 0.2%
32. Pearland, TX

-
Average one-way commute time to work: 33.1 minutes (25.4% higher than national average)
-
Driving alone in car, truck, or van: 32.9 minutes
-
Carpool: 33.4 minutes
-
Public transportation: 38.8 minutes
-
Workers with one-way commutes over 60 minutes: 11.9% (3.0% more than the national average)
-
Driving alone in car, truck, or van: 11.6%
-
Carpool: 10.7%
-
Public transportation: 18.4%
-
Workers 16 years and over: 58,409
-
Workers who drove a car, truck, or van: 52,117
-
Workers carpooling: 4,067
-
Workers taking public transportation: 158
-
Workers who commute outside their county of residence: 71.7%
-
Workers who commute outside their state of residence: 0.8%
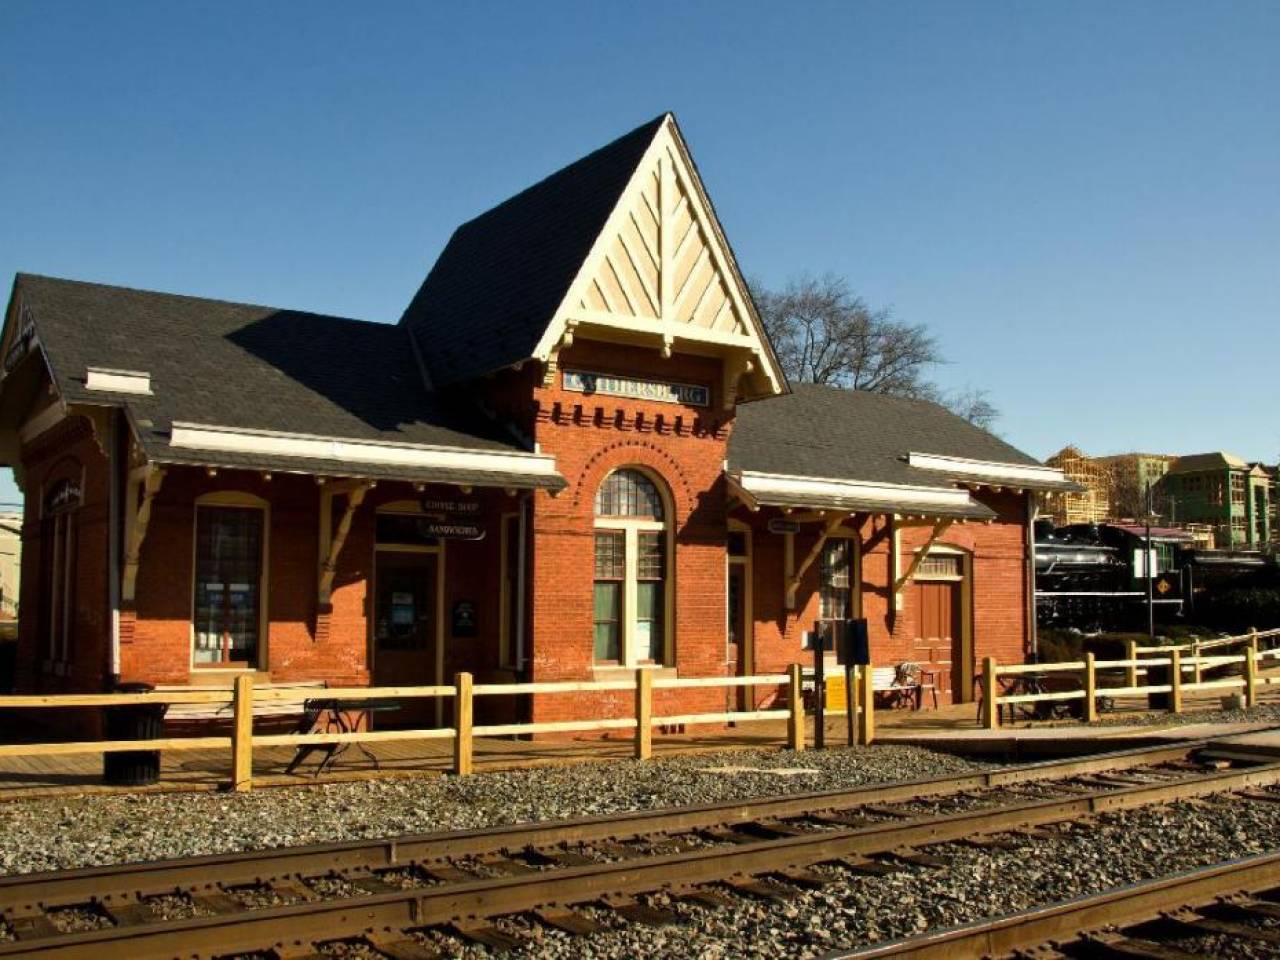
31. Gaithersburg, MD
-
Average one-way commute time to work: 33.1 minutes (25.4% higher than national average)
-
Driving alone in car, truck, or van: 29.7 minutes
-
Carpool: 31.9 minutes
-
Public transportation: 52.6 minutes
-
Workers with one-way commutes over 60 minutes: 18.8% (9.9% more than the national average)
-
Driving alone in car, truck, or van: 13.2%
-
Carpool: 14.6%
-
Public transportation: 51.2%
-
Workers 16 years and over: 35,858
-
Workers who drove a car, truck, or van: 24,276
-
Workers carpooling: 3,934
-
Workers taking public transportation: 4,888
-
Workers who commute outside their county of residence: 7.4%
-
Workers who commute outside their state of residence: 18.8%
30. Fremont, CA
-
Average one-way commute time to work: 33.6 minutes (27.3% higher than national average)
-
Driving alone in car, truck, or van: 30.2 minutes
-
Carpool: 32.1 minutes
-
Public transportation: 63.5 minutes
-
Workers with one-way commutes over 60 minutes: 15.8% (6.9% more than the national average)
-
Driving alone in car, truck, or van: 9.8%
-
Carpool: 11.6%
-
Public transportation: 68.5%
-
Workers 16 years and over: 86,040
-
Workers who drove a car, truck, or van: 62,362
-
Workers carpooling: 8,561
-
Workers taking public transportation: 8,098
-
Workers who commute outside their county of residence: 50.8%
-
Workers who commute outside their state of residence: 0.4%
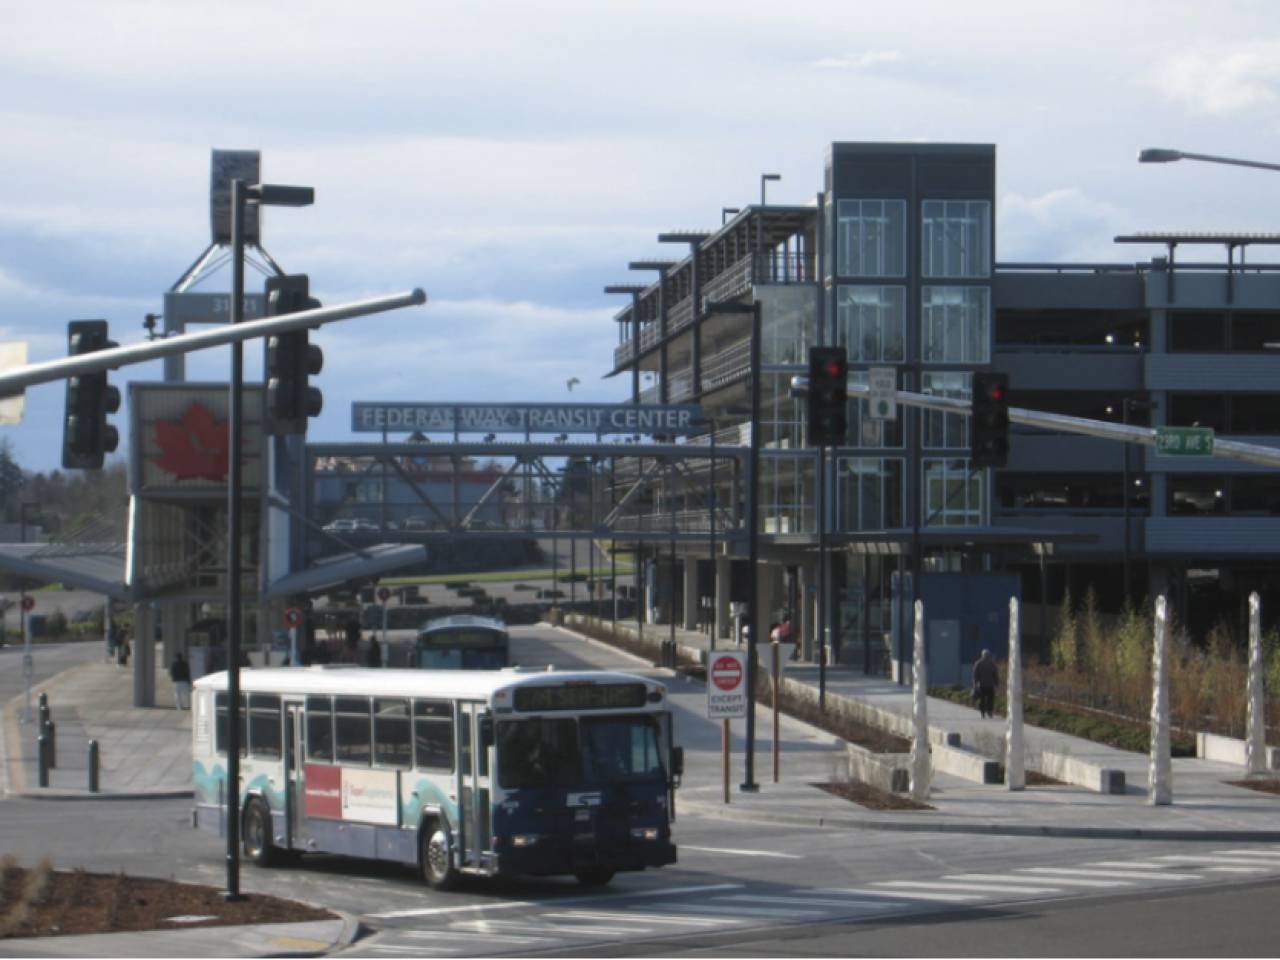
29. Federal Way, WA
-
Average one-way commute time to work: 33.6 minutes (27.3% higher than national average)
-
Driving alone in car, truck, or van: 30.3 minutes
-
Carpool: 40 minutes
-
Public transportation: 57.9 minutes
-
Workers with one-way commutes over 60 minutes: 17.1% (8.2% more than the national average)
-
Driving alone in car, truck, or van: 11.5%
-
Carpool: 24.7%
-
Public transportation: 58.1%
-
Workers 16 years and over: 46,080
-
Workers who drove a car, truck, or van: 33,481
-
Workers carpooling: 5,310
-
Workers taking public transportation: 3,777
-
Workers who commute outside their county of residence: 15.6%
-
Workers who commute outside their state of residence: 0.6%
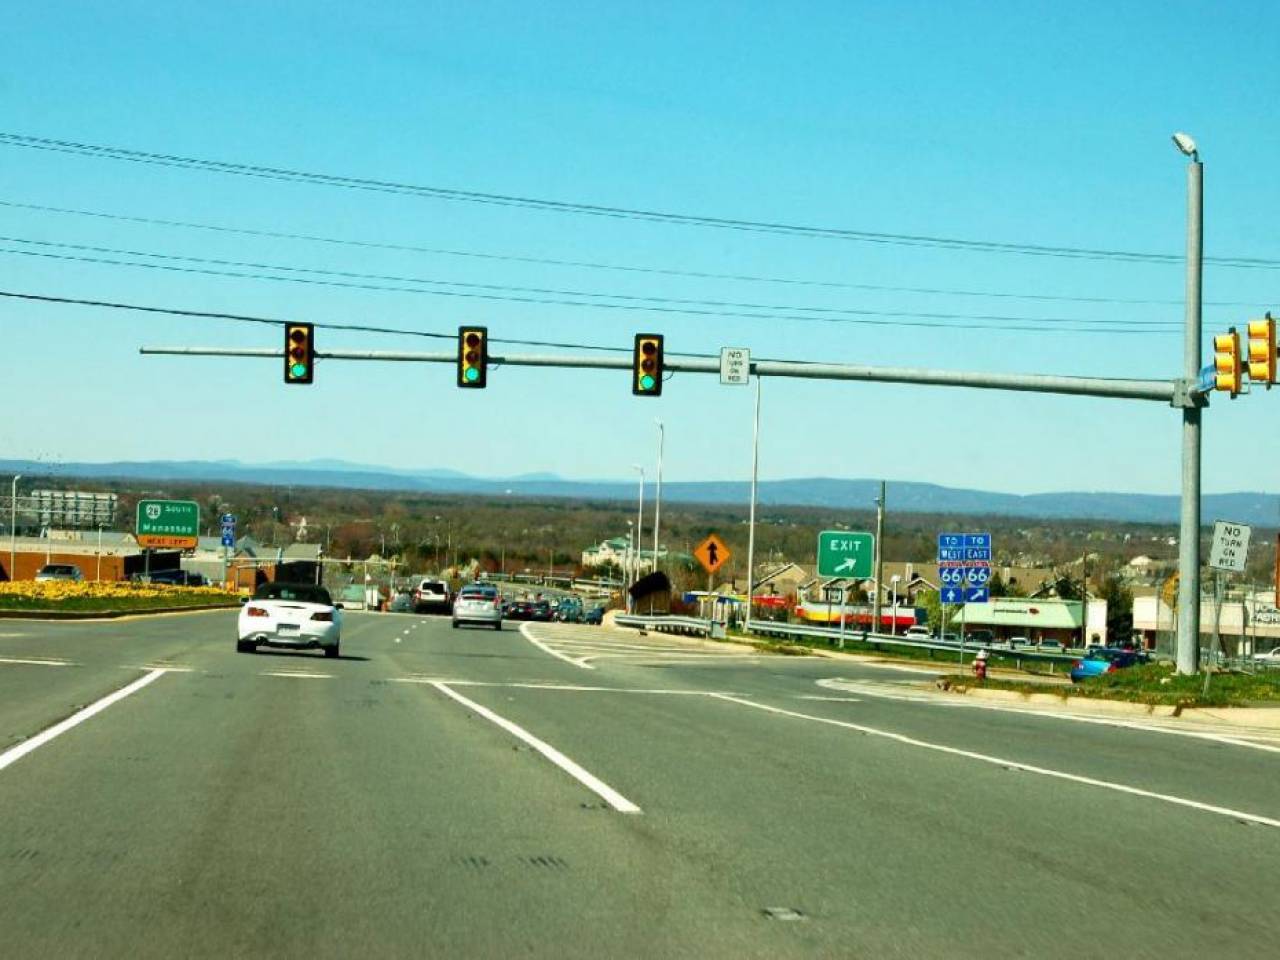
28. Centreville, VA
-
Average one-way commute time to work: 33.7 minutes (27.7% higher than national average)
-
Driving alone in car, truck, or van: 31 minutes
-
Carpool: 38.4 minutes
-
Public transportation: 81.2 minutes
-
Workers with one-way commutes over 60 minutes: 15.5% (6.6% more than the national average)
-
Driving alone in car, truck, or van: 10.8%
-
Carpool: 25.9%
-
Public transportation: 89.3%
-
Workers 16 years and over: 41,403
-
Workers who drove a car, truck, or van: 32,677
-
Workers carpooling: 3,816
-
Workers taking public transportation: 1,531
-
Workers who commute outside their county of residence: 24.6%
-
Workers who commute outside their state of residence: 11.3%
27. Naperville, IL
-
Average one-way commute time to work: 33.7 minutes (27.7% higher than national average)
-
Driving alone in car, truck, or van: 29.3 minutes
-
Carpool: 32.3 minutes
-
Public transportation: 69.1 minutes
-
Workers with one-way commutes over 60 minutes: 18.7% (9.8% more than the national average)
-
Driving alone in car, truck, or van: 11.3%
-
Carpool: 15%
-
Public transportation: 77.6%
-
Workers 16 years and over: 73,341
-
Workers who drove a car, truck, or van: 54,576
-
Workers carpooling: 3,121
-
Workers taking public transportation: 7,401
-
Workers who commute outside their county of residence: 45.9%
-
Workers who commute outside their state of residence: 1.4%
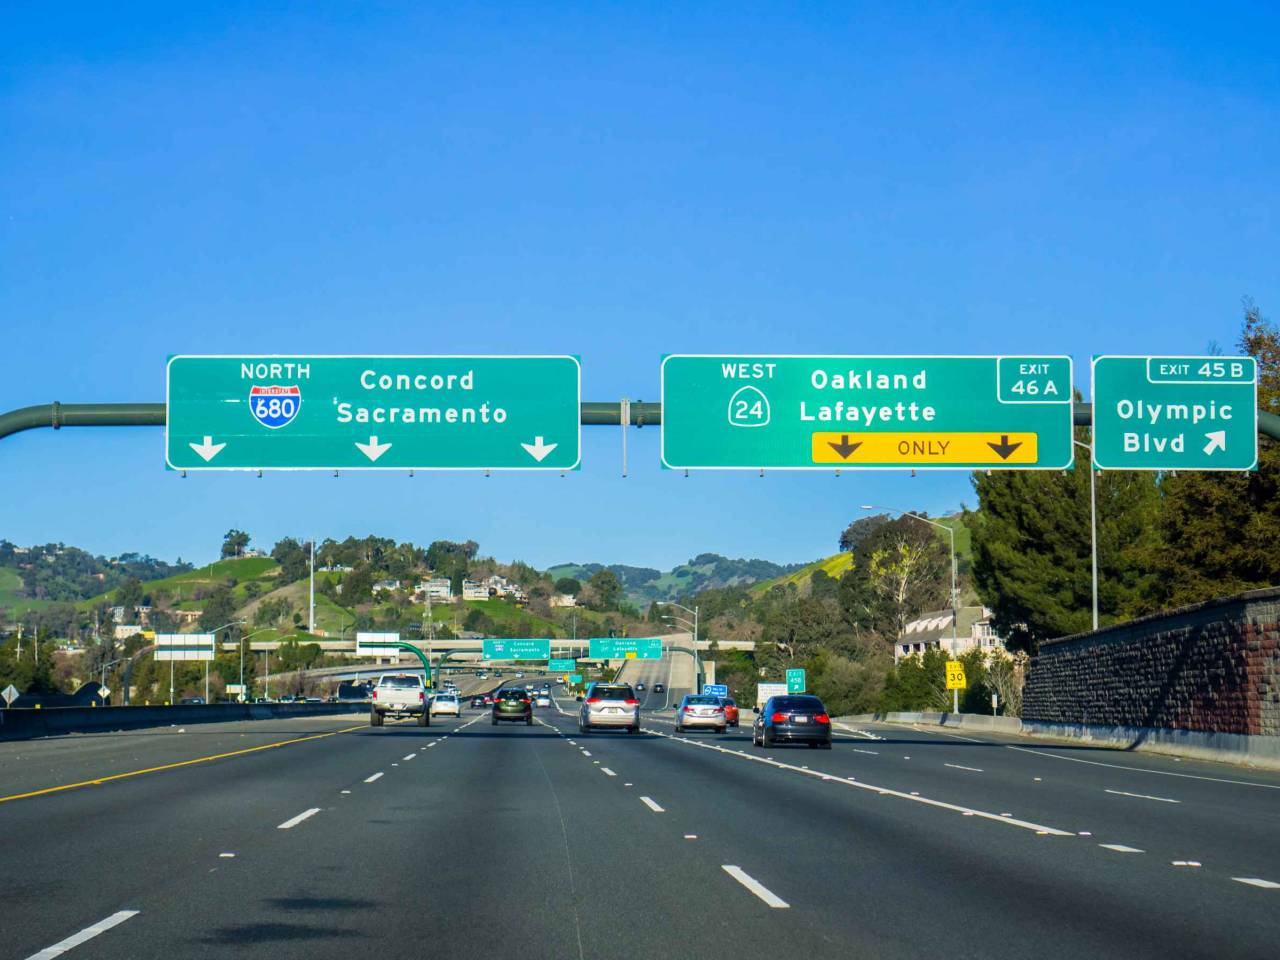
26. Concord, CA
-
Average one-way commute time to work: 33.8 minutes (28.0% higher than national average)
-
Driving alone in car, truck, or van: 30.2 minutes
-
Carpool: 35.4 minutes
-
Public transportation: 63 minutes
-
Workers with one-way commutes over 60 minutes: 20% (11.1% more than the national average)
-
Driving alone in car, truck, or van: 13.4%
-
Carpool: 22.1%
-
Public transportation: 67.2%
-
Workers 16 years and over: 61,743
-
Workers who drove a car, truck, or van: 43,277
-
Workers carpooling: 6,553
-
Workers taking public transportation: 6,020
-
Workers who commute outside their county of residence: 31.1%
-
Workers who commute outside their state of residence: 0.3%
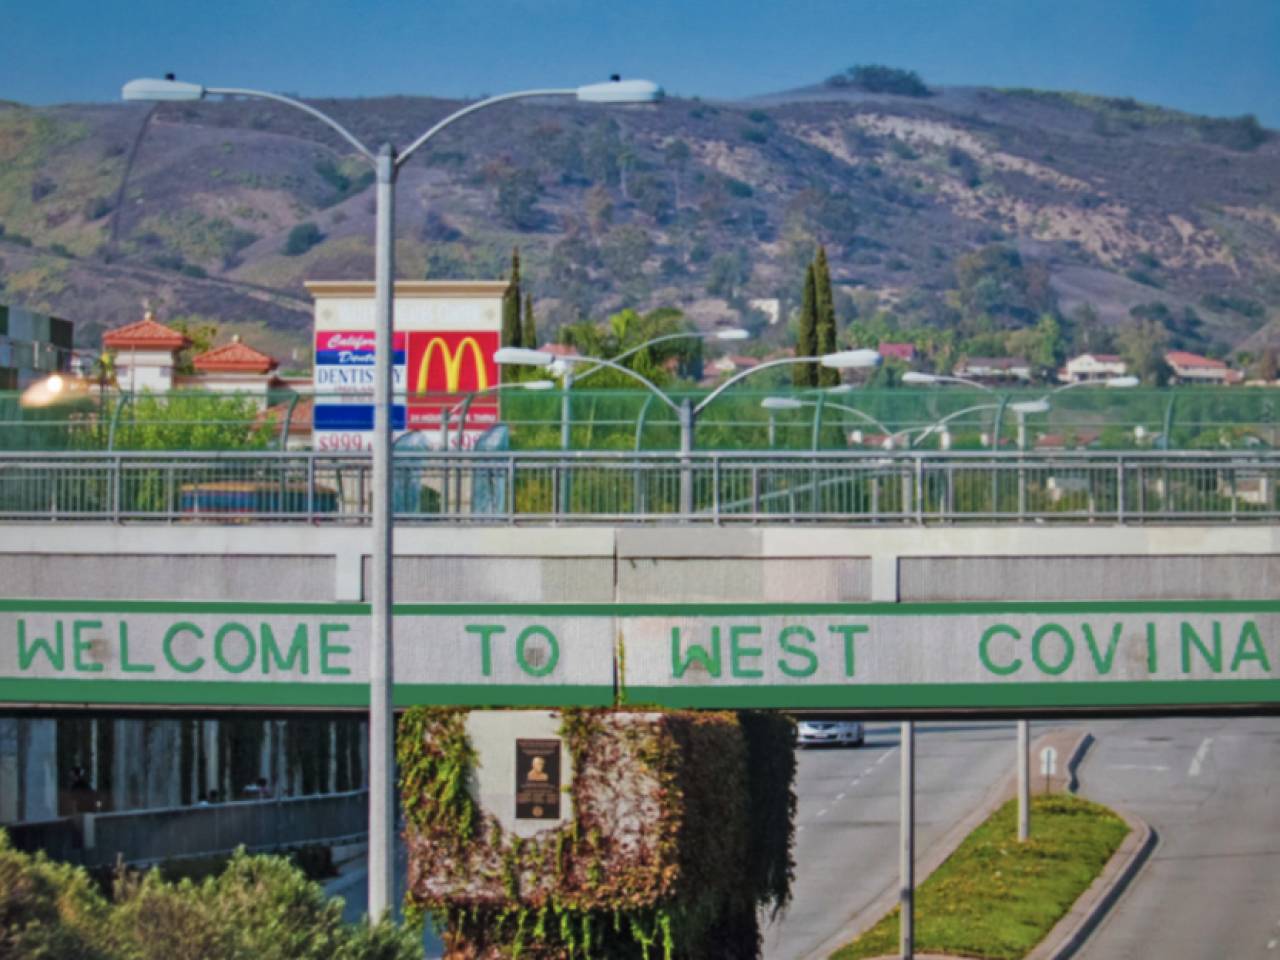
25. West Covina, CA
-
Average one-way commute time to work: 34 minutes (28.8% higher than national average)
-
Driving alone in car, truck, or van: 33.1 minutes
-
Carpool: 35.8 minutes
-
Public transportation: 52.8 minutes
-
Workers with one-way commutes over 60 minutes: 19.1% (10.2% more than the national average)
-
Driving alone in car, truck, or van: 17.7%
-
Carpool: 20.8%
-
Public transportation: 47.5%
-
Workers 16 years and over: 50,005
-
Workers who drove a car, truck, or van: 40,333
-
Workers carpooling: 5,218
-
Workers taking public transportation: 1,744
-
Workers who commute outside their county of residence: 13.6%
-
Workers who commute outside their state of residence: 0.2%
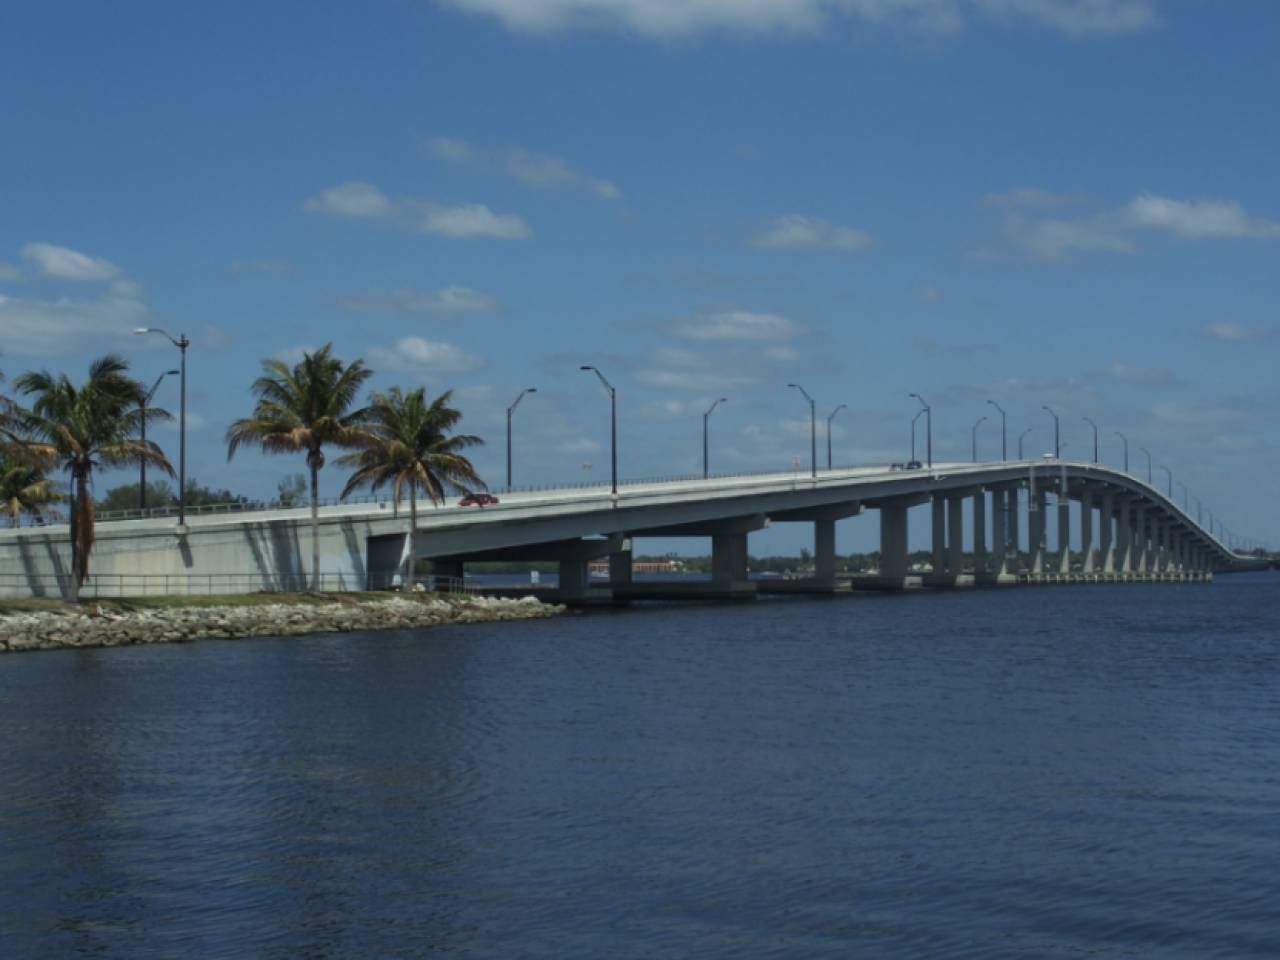
24. Lehigh Acres, FL
-
Average one-way commute time to work: 34.1 minutes (29.2% higher than national average)
-
Driving alone in car, truck, or van: 33.3 minutes
-
Carpool: 36.9 minutes
-
Public transportation: 60.8 minutes
-
Workers with one-way commutes over 60 minutes: 11.6% (2.7% more than the national average)
-
Driving alone in car, truck, or van: 10.5%
-
Carpool: 16.1%
-
Public transportation: 49.9%
-
Workers 16 years and over: 48,421
-
Workers who drove a car, truck, or van: 39,106
-
Workers carpooling: 5,847
-
Workers taking public transportation: 345
-
Workers who commute outside their county of residence: 13.1%
-
Workers who commute outside their state of residence: 0.5%
23. Pleasanton, CA

-
Average one-way commute time to work: 34.2 minutes (29.5% higher than national average)
-
Driving alone in car, truck, or van: 30.3 minutes
-
Carpool: 35 minutes
-
Public transportation: 68.2 minutes
-
Workers with one-way commutes over 60 minutes: 21.7% (12.8% more than the national average)
-
Driving alone in car, truck, or van: 15.5%
-
Carpool: 19.5%
-
Public transportation: 78%
-
Workers 16 years and over: 38,360
-
Workers who drove a car, truck, or van: 27,833
-
Workers carpooling: 2,719
-
Workers taking public transportation: 3,451
-
Workers who commute outside their county of residence: 38.1%
-
Workers who commute outside their state of residence: 0.5%
22. Yonkers, NY
-
Average one-way commute time to work: 34.3 minutes (29.9% higher than national average)
-
Driving alone in car, truck, or van: 26.2 minutes
-
Carpool: 28.3 minutes
-
Public transportation: 56.4 minutes
-
Workers with one-way commutes over 60 minutes: 20.4% (11.5% more than the national average)
-
Driving alone in car, truck, or van: 7.0%
-
Carpool: 10.1%
-
Public transportation: 53.9%
-
Workers 16 years and over: 92,169
-
Workers who drove a car, truck, or van: 49,406
-
Workers carpooling: 8,904
-
Workers taking public transportation: 25,307
-
Workers who commute outside their county of residence: 39%
-
Workers who commute outside their state of residence: 3.2%
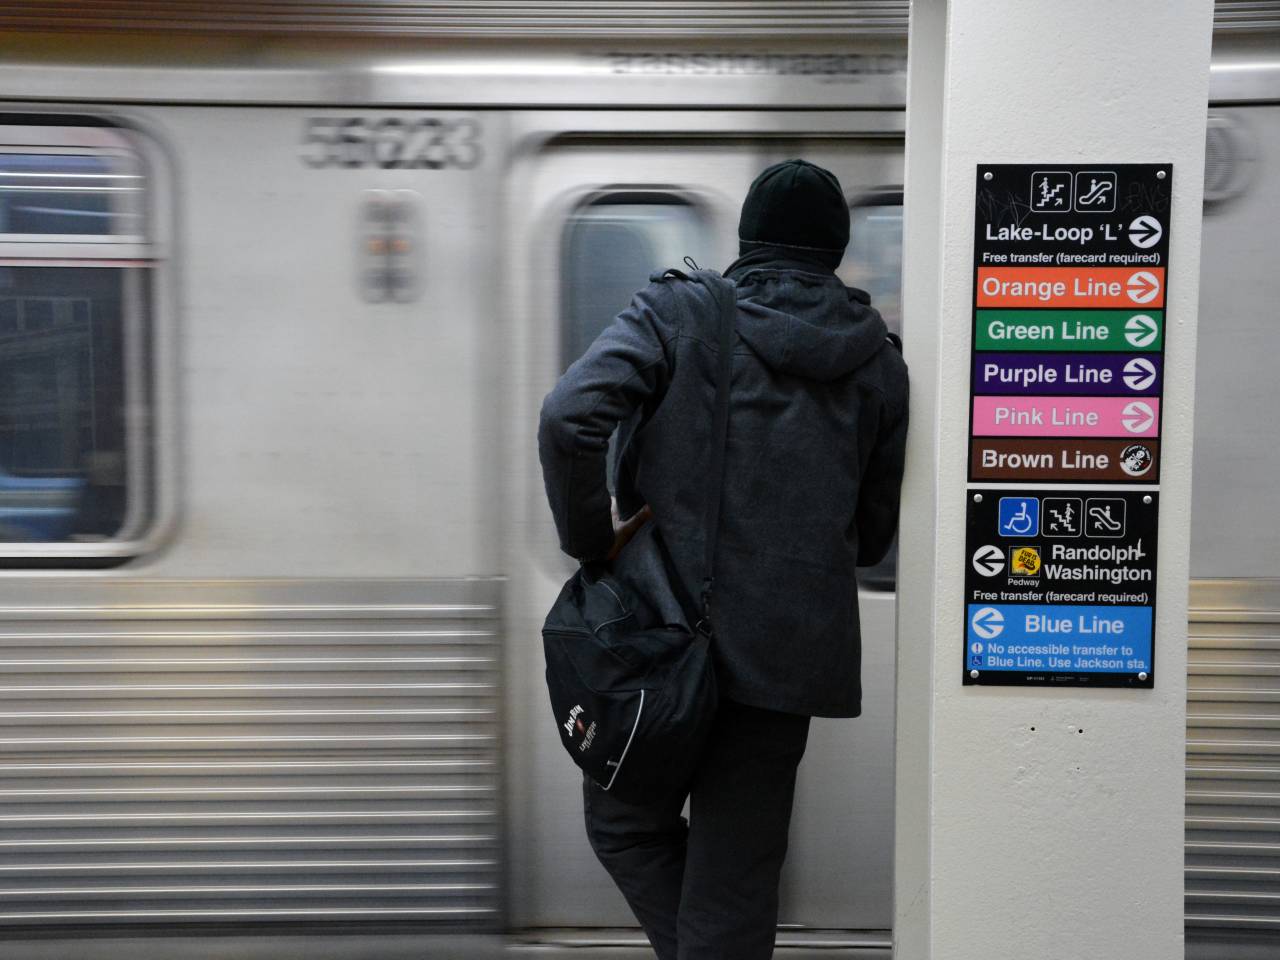
21. Chicago, IL
-
Average one-way commute time to work: 34.6 minutes (31.1% higher than national average)
-
Driving alone in car, truck, or van: 32.9 minutes
-
Carpool: 34.2 minutes
-
Public transportation: 43.3 minutes
-
Workers with one-way commutes over 60 minutes: 16.2% (7.3% more than the national average)
-
Driving alone in car, truck, or van: 13.6%
-
Carpool: 15.7%
-
Public transportation: 25.3%
-
Workers 16 years and over: 1,288,225
-
Workers who drove a car, truck, or van: 633,387
-
Workers carpooling: 101,904
-
Workers taking public transportation: 363,149
-
Workers who commute outside their county of residence: 6%
-
Workers who commute outside their state of residence: 1.2%
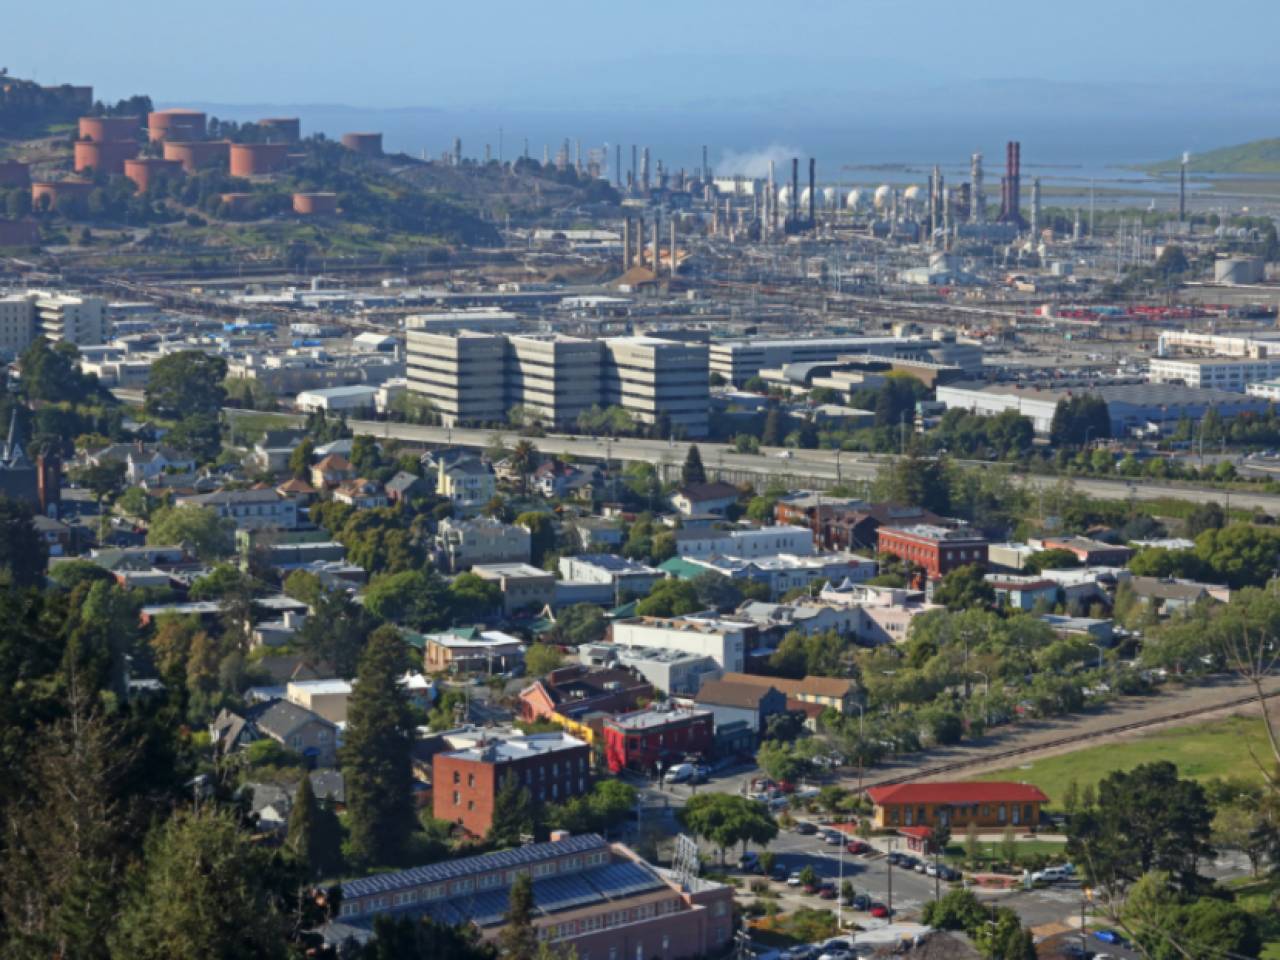
20. Richmond, CA
-
Average one-way commute time to work: 34.7 minutes (31.4% higher than national average)
-
Driving alone in car, truck, or van: 29.9 minutes
-
Carpool: 34.6 minutes
-
Public transportation: 55.8 minutes
-
Workers with one-way commutes over 60 minutes: 18.5% (9.6% more than the national average)
-
Driving alone in car, truck, or van: 11.2%
-
Carpool: 18.9%
-
Public transportation: 48.5%
-
Workers 16 years and over: 50,469
-
Workers who drove a car, truck, or van: 30,012
-
Workers carpooling: 9,205
-
Workers taking public transportation: 7,056
-
Workers who commute outside their county of residence: 61.3%
-
Workers who commute outside their state of residence: 0.4%
19. Victorville, CA

-
Average one-way commute time to work: 34.7 minutes (31.4% higher than national average)
-
Driving alone in car, truck, or van: 32.5 minutes
-
Carpool: 48.1 minutes
-
Public transportation: 45.6 minutes
-
Workers with one-way commutes over 60 minutes: 21.1% (12.2% more than the national average)
-
Driving alone in car, truck, or van: 18.6%
-
Carpool: 33.9%
-
Public transportation: 49%
-
Workers 16 years and over: 39,863
-
Workers who drove a car, truck, or van: 31,028
-
Workers carpooling: 5,602
-
Workers taking public transportation: 247
-
Workers who commute outside their county of residence: 15.5%
-
Workers who commute outside their state of residence: 0.5%
18. Vallejo, CA
-
Average one-way commute time to work: 34.8 minutes (31.8% higher than national average)
-
Driving alone in car, truck, or van: 31.7 minutes
-
Carpool: 39 minutes
-
Public transportation: 74.4 minutes
-
Workers with one-way commutes over 60 minutes: 21.3% (12.4% more than the national average)
-
Driving alone in car, truck, or van: 16.5%
-
Carpool: 27.8%
-
Public transportation: 77.5%
-
Workers 16 years and over: 52,801
-
Workers who drove a car, truck, or van: 38,065
-
Workers carpooling: 8,852
-
Workers taking public transportation: 2,549
-
Workers who commute outside their county of residence: 56.6%
-
Workers who commute outside their state of residence: 0.5%
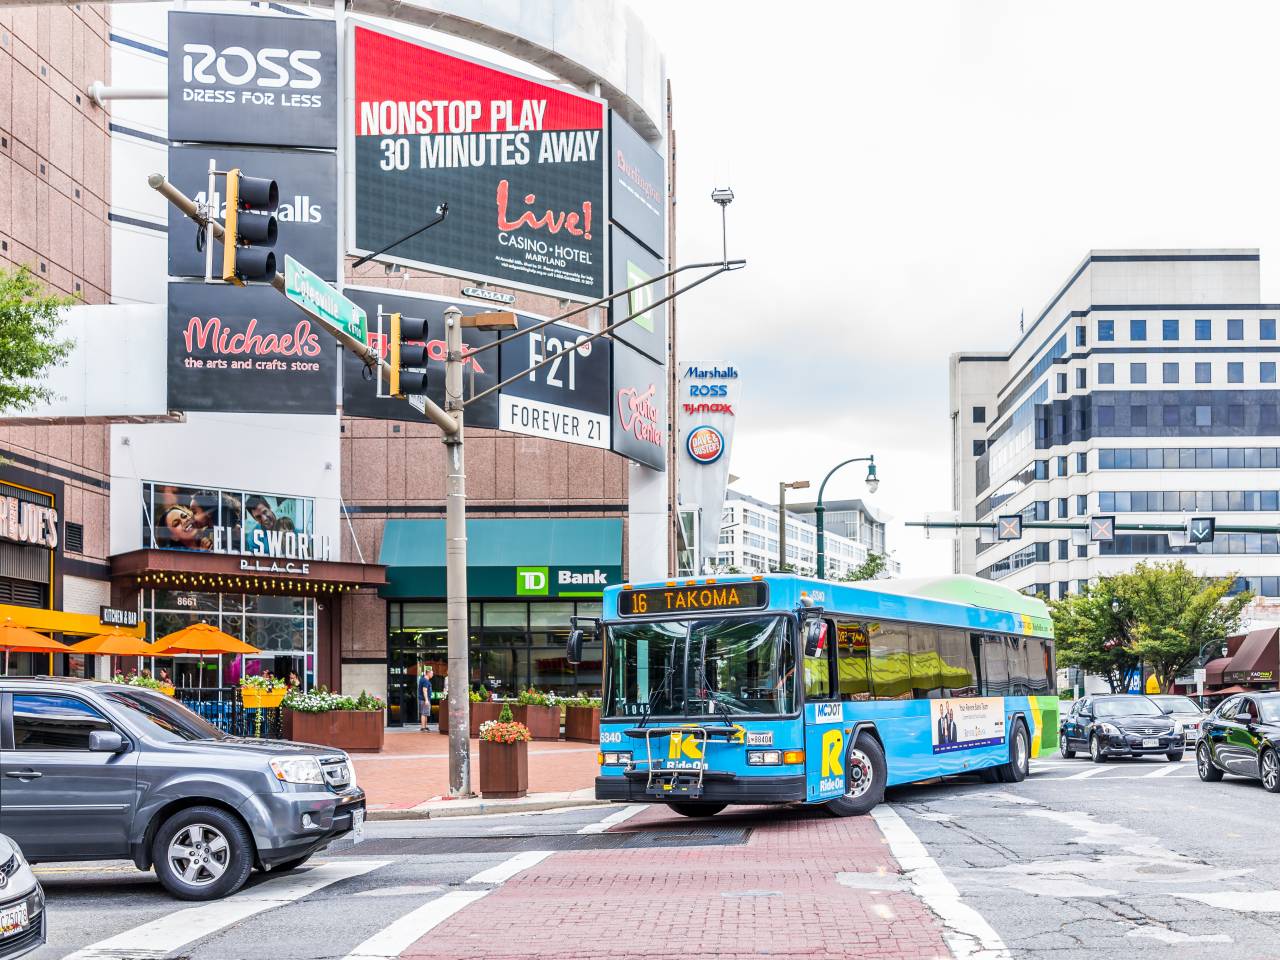
17. Silver Spring, MD
-
Average one-way commute time to work: 34.9 minutes (32.2% higher than national average)
-
Driving alone in car, truck, or van: 30.1 minutes
-
Carpool: 35.9 minutes
-
Public transportation: 46 minutes
-
Workers with one-way commutes over 60 minutes: 14.6% (5.7% more than the national average)
-
Driving alone in car, truck, or van: 7%
-
Carpool: 19.3%
-
Public transportation: 28.3%
-
Workers 16 years and over: 44,522
-
Workers who drove a car, truck, or van: 22,612
-
Workers carpooling: 4,801
-
Workers taking public transportation: 12,768
-
Workers who commute outside their county of residence: 15.6%
-
Workers who commute outside their state of residence: 41.3%
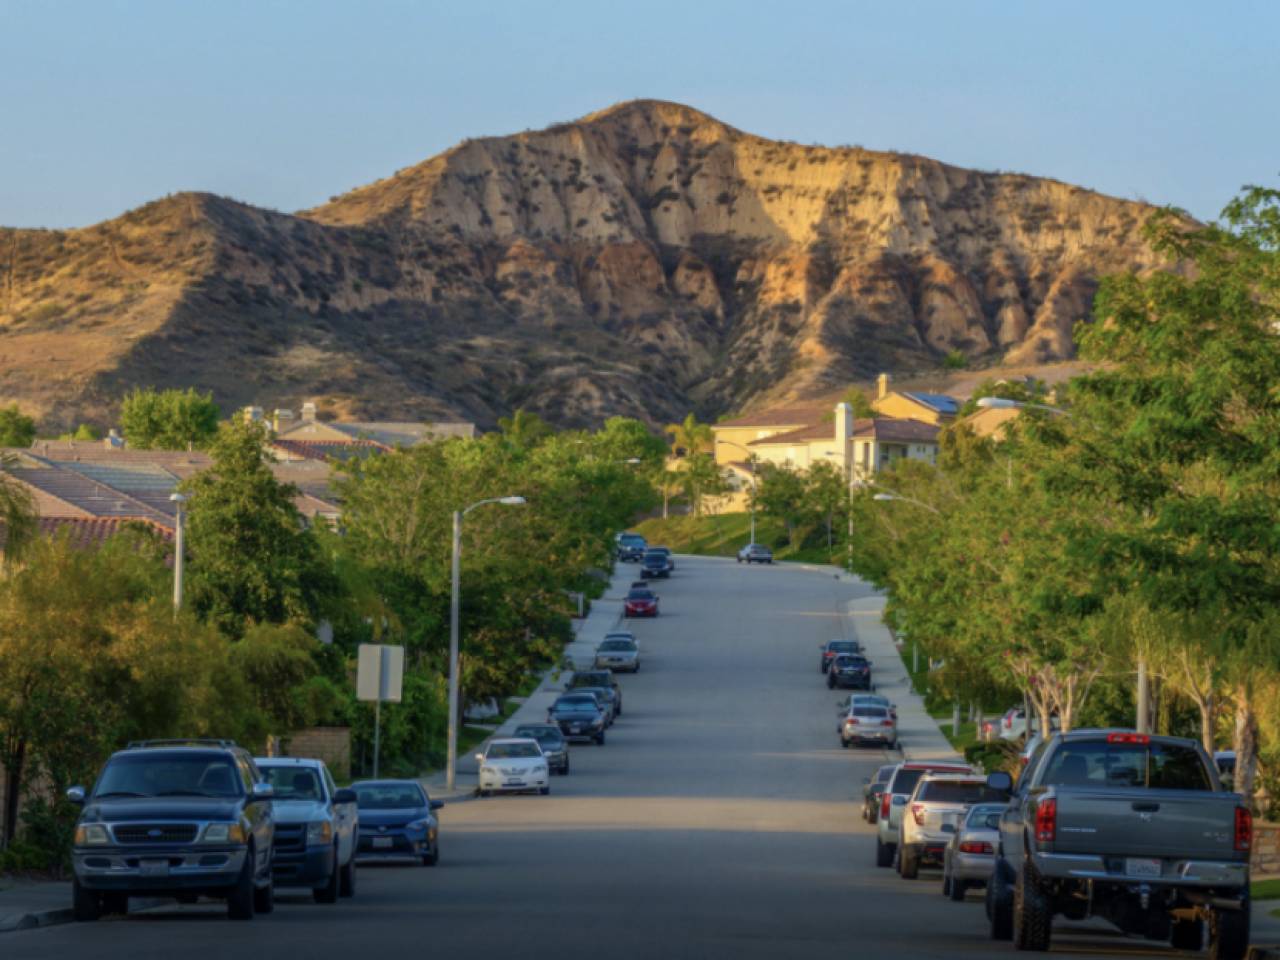
16. Santa Clarita, CA
-
Average one-way commute time to work: 34.9 minutes (32.2% higher than national average)
-
Driving alone in car, truck, or van: 33.6 minutes
-
Carpool: 36.5 minutes
-
Public transportation: 67.5 minutes
-
Workers with one-way commutes over 60 minutes: 19.7% (10.8% more than the national average)
-
Driving alone in car, truck, or van: 18%
-
Carpool: 21.8%
-
Public transportation: 64.2%
-
Workers 16 years and over: 100,616
-
Workers who drove a car, truck, or van: 77,049
-
Workers carpooling: 11,390
-
Workers taking public transportation: 3,056
-
Workers who commute outside their county of residence: 3.8%
-
Workers who commute outside their state of residence: 0.5%
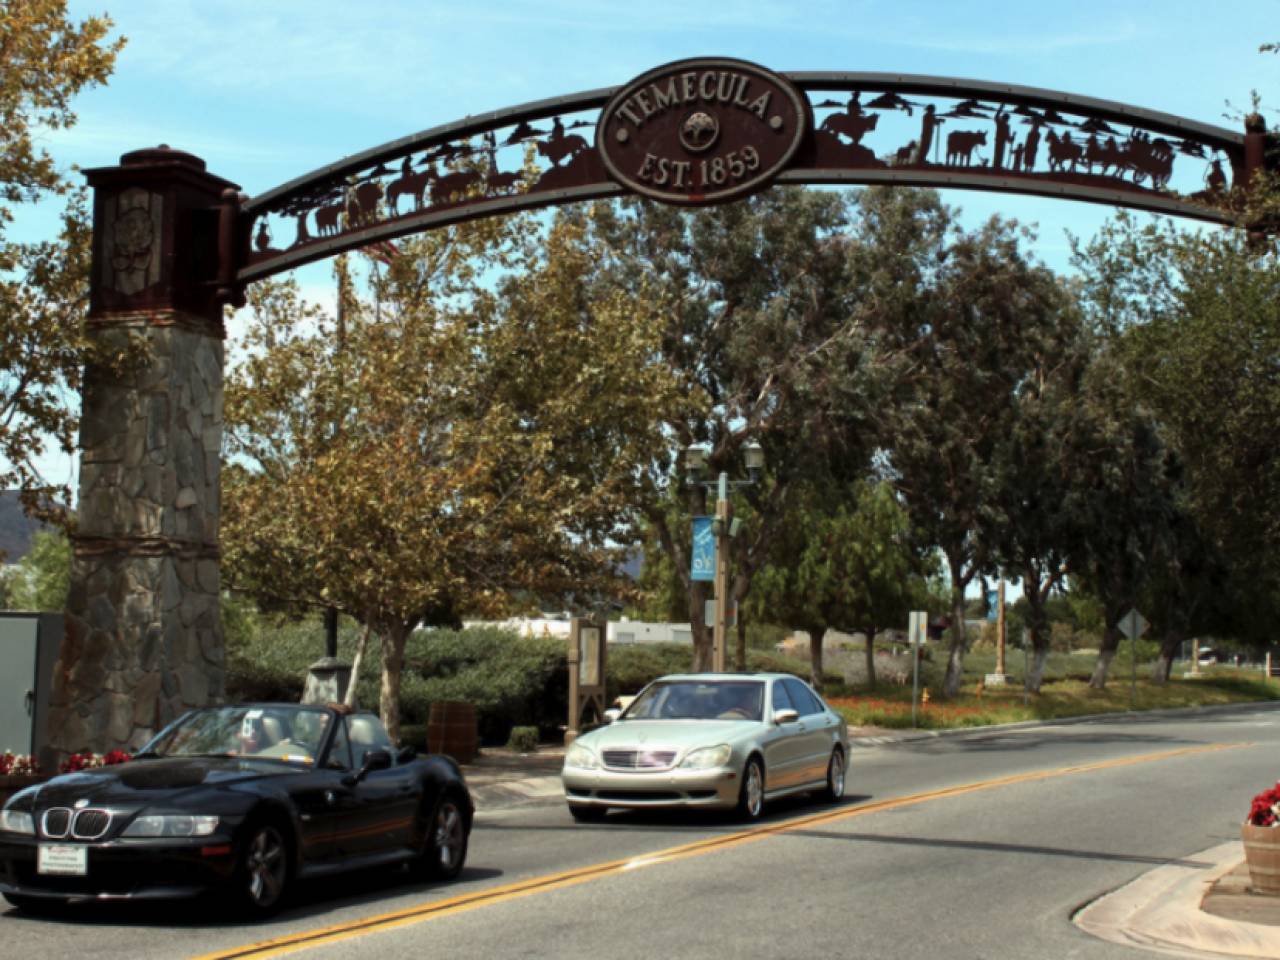
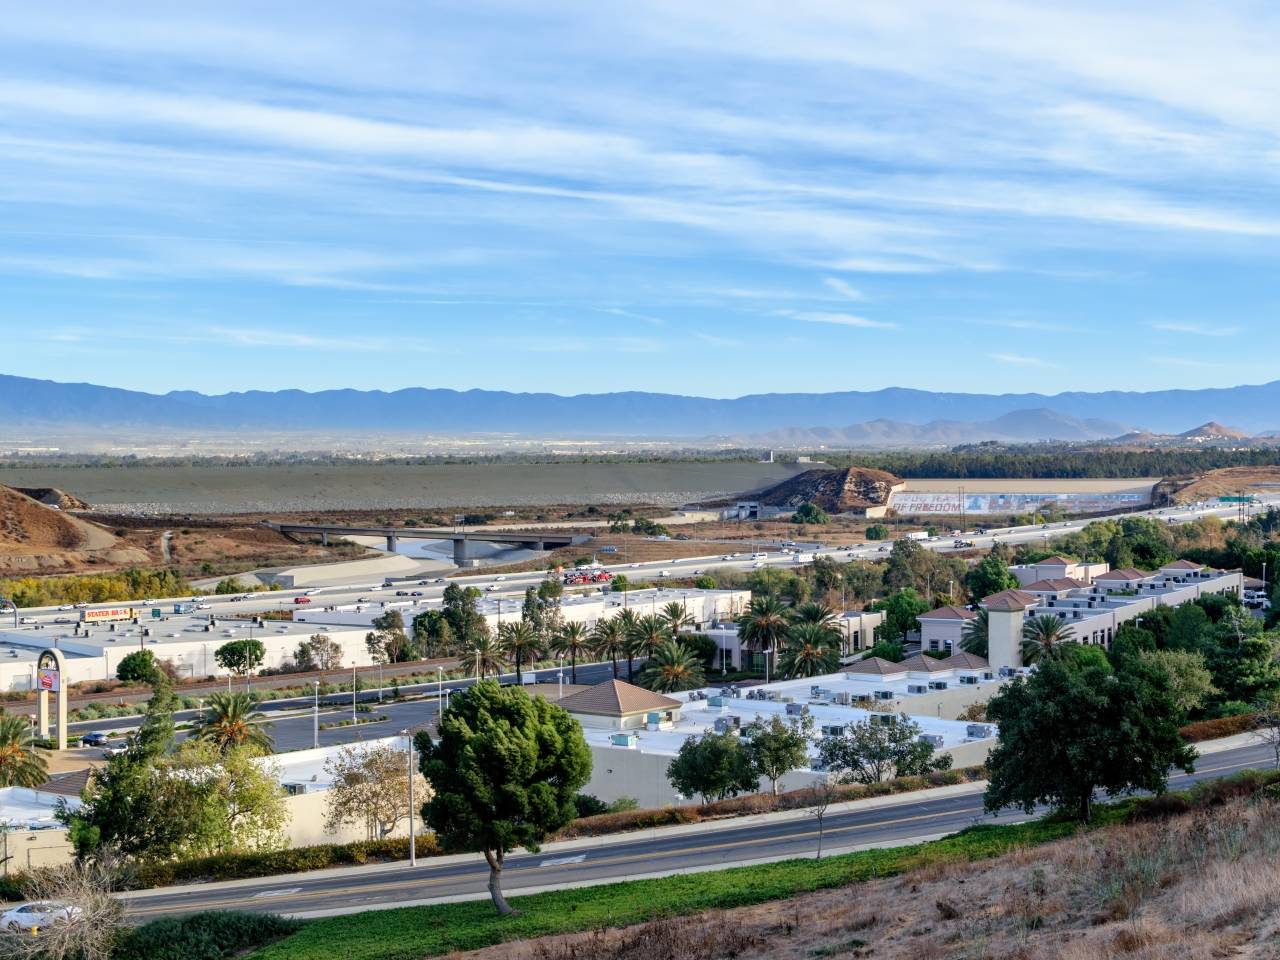
15. Temecula, CA
-
Average one-way commute time to work: 34.9 minutes (32.2% higher than national average)
-
Driving alone in car, truck, or van: 34.5 minutes
-
Carpool: 40.3 minutes
-
Public transportation: 34.1 minutes
-
Workers with one-way commutes over 60 minutes: 24.2% (15.3% more than the national average)
-
Driving alone in car, truck, or van: 23.8%
-
Carpool: 31%
-
Public transportation: 1%
-
Workers 16 years and over: 49,647
-
Workers who drove a car, truck, or van: 38,553
-
Workers carpooling: 5,631
-
Workers taking public transportation: 101
-
Workers who commute outside their county of residence: 36.6%
-
Workers who commute outside their state of residence: 0.7%
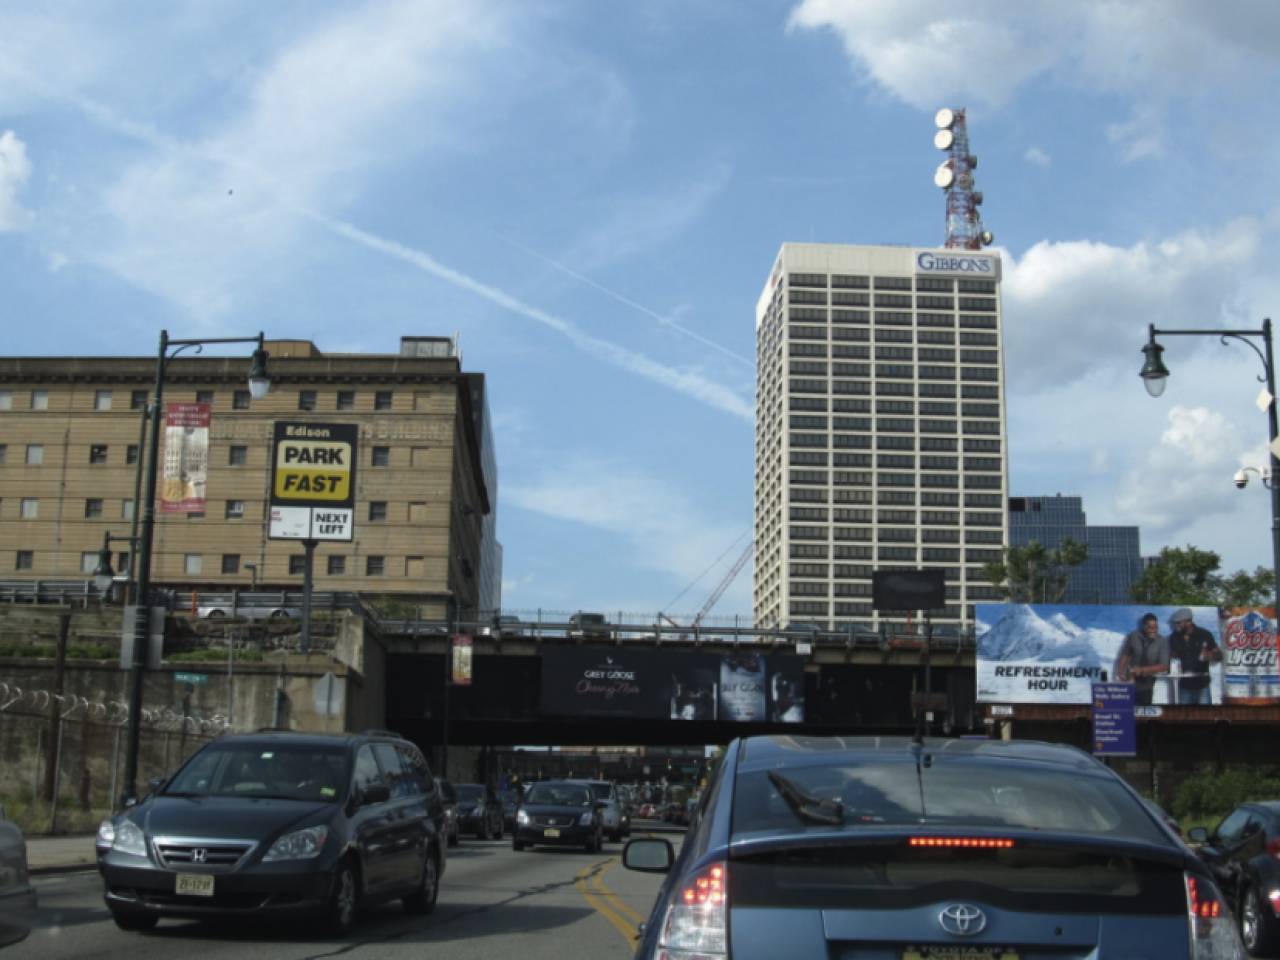
14. Newark, NJ
-
Average one-way commute time to work: 35.5 minutes (34.5% higher than national average)
-
Driving alone in car, truck, or van: 28.9 minutes
-
Carpool: 33.9 minutes
-
Public transportation: 55.6 minutes
-
Workers with one-way commutes over 60 minutes: 20.6% (11.7% more than the national average)
-
Driving alone in car, truck, or van: 10.1%
-
Carpool: 19.6%
-
Public transportation: 47.3%
-
Workers 16 years and over: 113,302
-
Workers who drove a car, truck, or van: 58,077
-
Workers carpooling: 12,667
-
Workers taking public transportation: 29,791
-
Workers who commute outside their county of residence: 31.6%
-
Workers who commute outside their state of residence: 10.9%
13. Quincy, MA
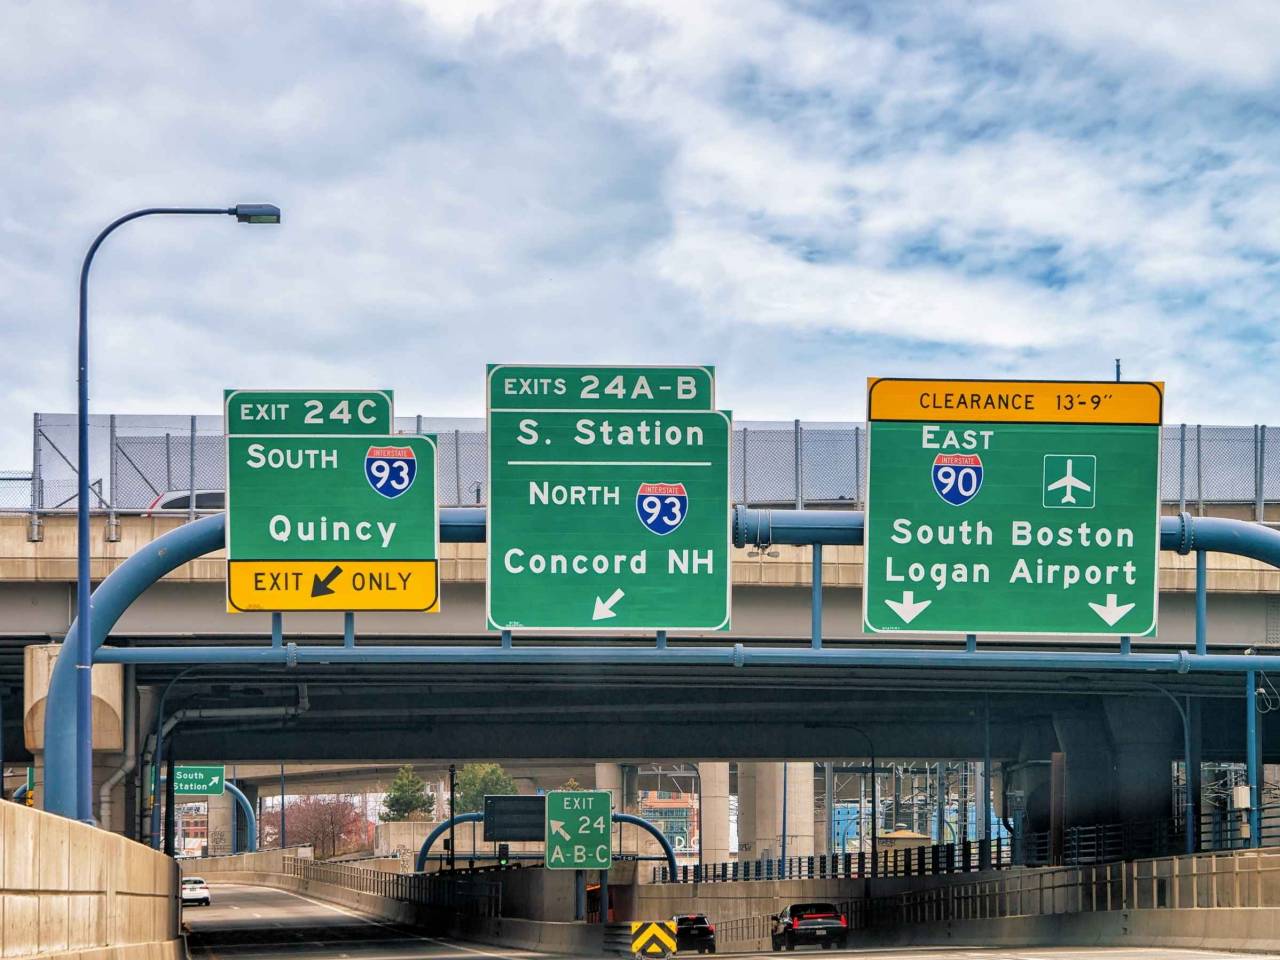
-
Average one-way commute time to work: 35.6 minutes (34.8% higher than national average)
-
Driving alone in car, truck, or van: 31 minutes
-
Carpool: 31.8 minutes
-
Public transportation: 48.4 minutes
-
Workers with one-way commutes over 60 minutes: 18.9% (10.0% more than the national average)
-
Driving alone in car, truck, or van: 13.6%
-
Carpool: 15.8%
-
Public transportation: 32.1%
-
Workers 16 years and over: 52,315
-
Workers who drove a car, truck, or van: 29,819
-
Workers carpooling: 4,731
-
Workers taking public transportation: 14,706
-
Workers who commute outside their county of residence: 59%
-
Workers who commute outside their state of residence: 1%
12. Germantown, MD
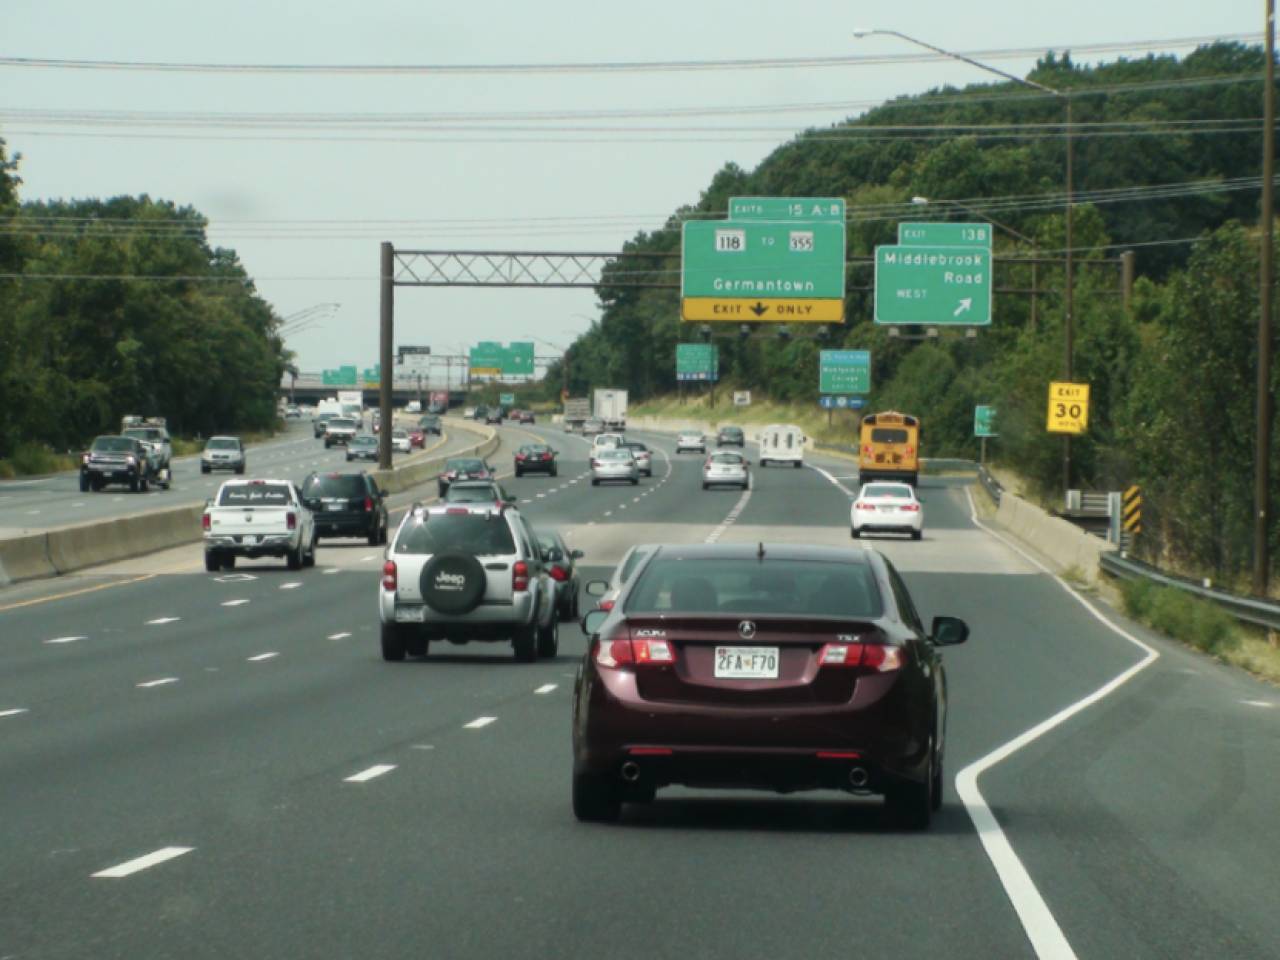
-
Average one-way commute time to work: 36.4 minutes (37.9% higher than national average)
-
Driving alone in car, truck, or van: 33.6 minutes
-
Carpool: 33.7 minutes
-
Public transportation: 62.8 minutes
-
Workers with one-way commutes over 60 minutes: 20.9% (12.0% more than the national average)
-
Driving alone in car, truck, or van: 16.8%
-
Carpool: 12.9%
-
Public transportation: 63.3%
-
Workers 16 years and over: 49,794
-
Workers who drove a car, truck, or van: 36,746
-
Workers carpooling: 5,176
-
Workers taking public transportation: 4,855
-
Workers who commute outside their county of residence: 9.5%
-
Workers who commute outside their state of residence: 16.8%
11. San Tan Valley, AZ
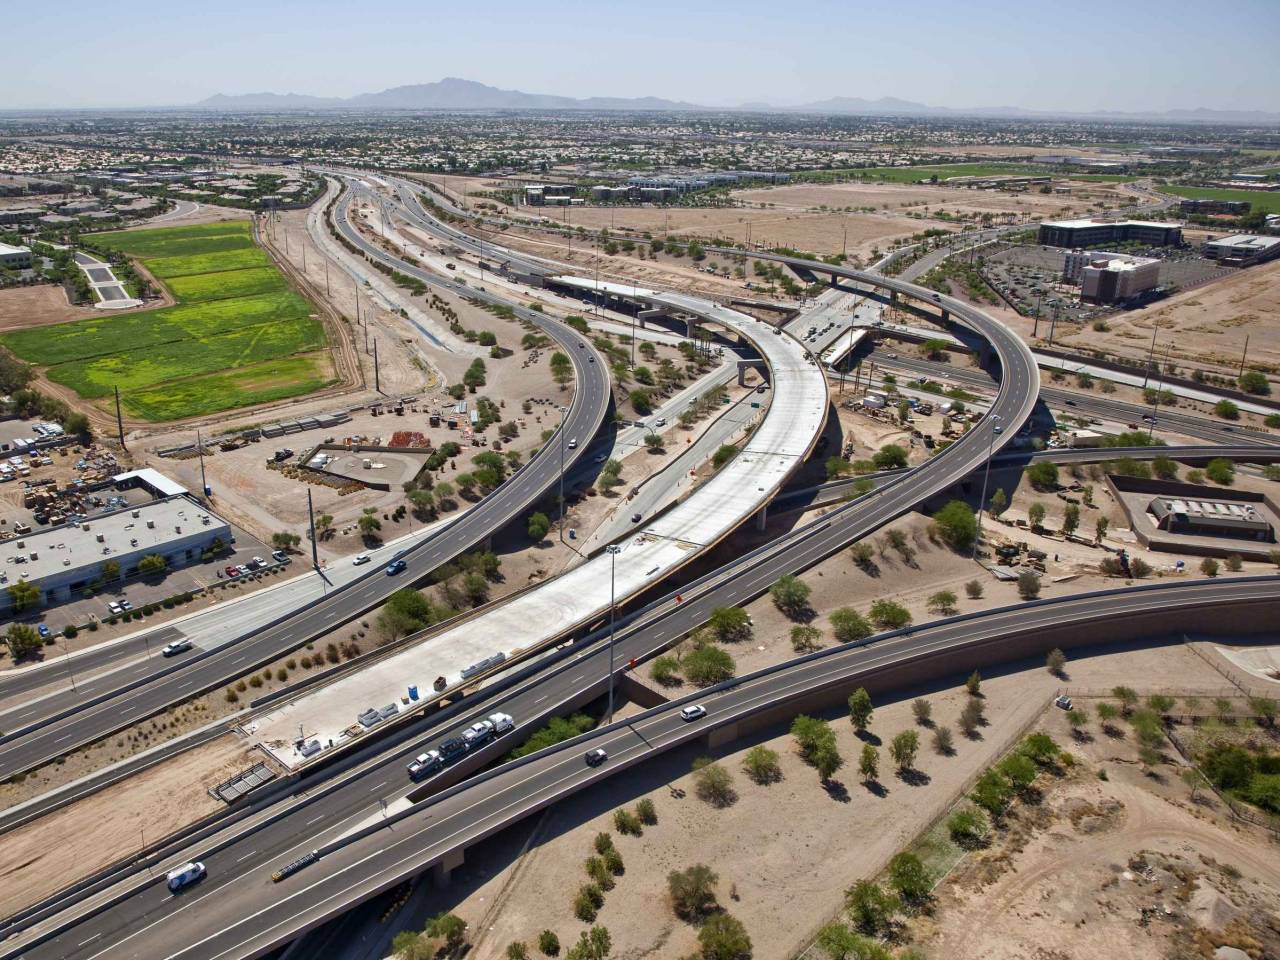
-
Average one-way commute time to work: 36.5 minutes (38.3% higher than national average)
-
Driving alone in car, truck, or van: 36.7 minutes
-
Carpool: 35.5 minutes
-
Public transportation: 72.2 minutes
-
Workers with one-way commutes over 60 minutes: 17% (8.1% more than the national average)
-
Driving alone in car, truck, or van: 16.8%
-
Carpool: 18%
-
Public transportation: 84.2%
-
Workers 16 years and over: 38,110
-
Workers who drove a car, truck, or van: 30,560
-
Workers carpooling: 4,571
-
Workers taking public transportation: 120
-
Workers who commute outside their county of residence: 67.5%
-
Workers who commute outside their state of residence: 0.9%
10. Corona, CA
-
Average one-way commute time to work: 36.7 minutes (39% higher than national average)
-
Driving alone in car, truck, or van: 35.3 minutes
-
Carpool: 44.6 minutes
-
Public transportation: 63.7 minutes
-
Workers with one-way commutes over 60 minutes: 23.6% (14.7% more than the national average)
-
Driving alone in car, truck, or van: 21.7%
-
Carpool: 33.4%
-
Public transportation: 57.1%
-
Workers 16 years and over: 76,203
-
Workers who drove a car, truck, or van: 59,157
-
Workers carpooling: 9,933
-
Workers taking public transportation: 1,231
-
Workers who commute outside their county of residence: 49.1%
-
Workers who commute outside their state of residence: 0.5%
9. Jersey City, NJ
-
Average one-way commute time to work: 36.8 minutes (39.4% higher than national average)
-
Driving alone in car, truck, or van: 30.9 minutes
-
Carpool: 31.3 minutes
-
Public transportation: 45.1 minutes
-
Workers with one-way commutes over 60 minutes: 18.7% (9.8% more than the national average)
-
Driving alone in car, truck, or van: 11.5%
-
Carpool: 14.7%
-
Public transportation: 27%
-
Workers 16 years and over: 133,529
-
Workers who drove a car, truck, or van: 42,190
-
Workers carpooling: 9,236
-
Workers taking public transportation: 64,735
-
Workers who commute outside their county of residence: 17.8%
-
Workers who commute outside their state of residence: 36.5%
8. San Ramon, CA
-
Average one-way commute time to work: 37.2 minutes (40.9% higher than national average)
-
Driving alone in car, truck, or van: 33 minutes
-
Carpool: 41.9 minutes
-
Public transportation: 74.7 minutes
-
Workers with one-way commutes over 60 minutes: 25.4% (16.5% more than the national average)
-
Driving alone in car, truck, or van: 18.4%
-
Carpool: 32.8%
-
Public transportation: 85.9%
-
Workers 16 years and over: 36,182
-
Workers who drove a car, truck, or van: 26,543
-
Workers carpooling: 2,849
-
Workers taking public transportation: 2,790
-
Workers who commute outside their county of residence: 56.7%
-
Workers who commute outside their state of residence: 0.8%
7. Chino Hills, CA

-
Average one-way commute time to work: 38.9 minutes (47.3% higher than national average)
-
Driving alone in car, truck, or van: 37.9 minutes
-
Carpool: 43.3 minutes
-
Public transportation: 69.1 minutes
-
Workers with one-way commutes over 60 minutes: 23.4% (14.5% more than the national average)
-
Driving alone in car, truck, or van: 21.2%
-
Carpool: 32.5%
-
Public transportation: 77.8%
-
Workers 16 years and over: 37,254
-
Workers who drove a car, truck, or van: 30,201
-
Workers carpooling: 3,836
-
Workers taking public transportation: 586
-
Workers who commute outside their county of residence: 66%
-
Workers who commute outside their state of residence: 0.2%
6. Hoboken, NJ
-
Average one-way commute time to work: 39.4 minutes (49.2% higher than national average)
-
Driving alone in car, truck, or van: 40.8 minutes
-
Carpool: 39.9 minutes
-
Public transportation: 42.2 minutes
-
Workers with one-way commutes over 60 minutes: 13.6% (4.7% more than the national average)
-
Driving alone in car, truck, or van: 20%
-
Carpool: 18%
-
Public transportation: 12.7%
-
Workers 16 years and over: 35,394
-
Workers who drove a car, truck, or van: 8,405
-
Workers carpooling: 655
-
Workers taking public transportation: 21,572
-
Workers who commute outside their county of residence: 18.6%
-
Workers who commute outside their state of residence: 57.5%
5. Dale City, VA
-
Average one-way commute time to work: 39.4 minutes (49.2% higher than national average)
-
Driving alone in car, truck, or van: 37.5 minutes
-
Carpool: 43.9 minutes
-
Public transportation: 61.9 minutes
-
Workers with one-way commutes over 60 minutes: 25.2% (16.3% more than the national average)
-
Driving alone in car, truck, or van: 21.3%
-
Carpool: 33.7%
-
Public transportation: 66%
-
Workers 16 years and over: 37,302
-
Workers who drove a car, truck, or van: 28,424
-
Workers carpooling: 4,652
-
Workers taking public transportation: 2,023
-
Workers who commute outside their county of residence: 46.1%
-
Workers who commute outside their state of residence: 14.3%
4. New York, NY

-
Average one-way commute time to work: 40.8 minutes (54.5% higher than national average)
-
Driving alone in car, truck, or van: 33.9 minutes
-
Carpool: 37.9 minutes
-
Public transportation: 48.7 minutes
-
Workers with one-way commutes over 60 minutes: 26.1% (17.2% more than the national average)
-
Driving alone in car, truck, or van: 16.2%
-
Carpool: 21.3%
-
Public transportation: 35.5%
-
Workers 16 years and over: 3,975,121
-
Workers who drove a car, truck, or van: 874,860
-
Workers carpooling: 183,025
-
Workers taking public transportation: 2,247,732
-
Workers who commute outside their county of residence: 42.8%
-
Workers who commute outside their state of residence: 2.8%
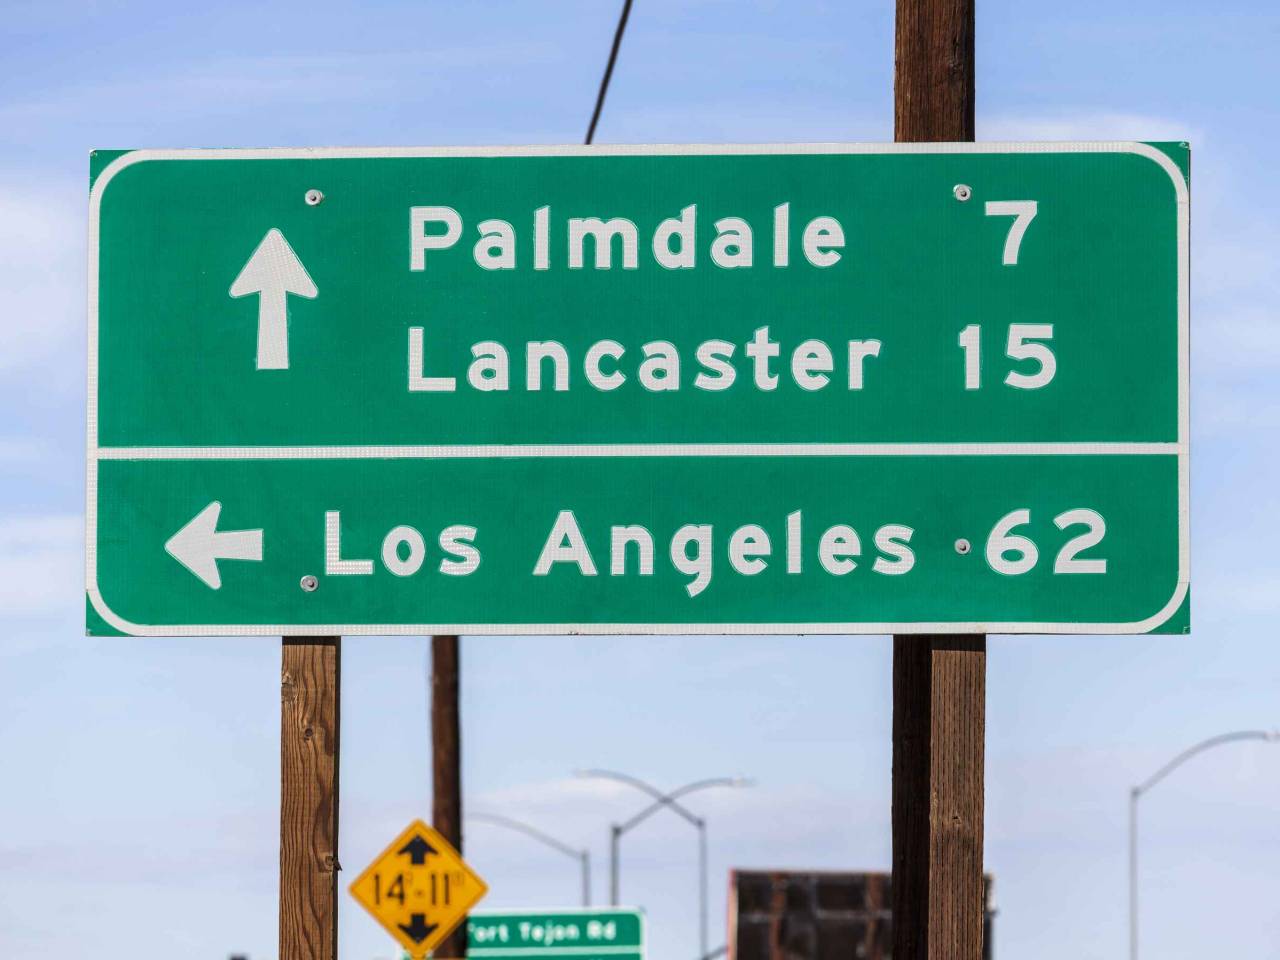
3. Palmdale, CA
-
Average one-way commute time to work: 42.7 minutes (61.7% higher than national average)
-
Driving alone in car, truck, or van: 39.2 minutes
-
Carpool: 55.6 minutes
-
Public transportation: 86.6 minutes
-
Workers with one-way commutes over 60 minutes: 35% (26.1% more than the national average)
-
Driving alone in car, truck, or van: 30.8%
-
Carpool: 52%
-
Public transportation: 81%
-
Workers 16 years and over: 59,045
-
Workers who drove a car, truck, or van: 45,132
-
Workers carpooling: 8,851
-
Workers taking public transportation: 1,159
-
Workers who commute outside their county of residence: 5%
-
Workers who commute outside their state of residence: 0.4%
2. Tracy, CA
-
Average one-way commute time to work: 43.5 minutes (64.8% higher than national average)
-
Driving alone in car, truck, or van: 39.9 minutes
-
Carpool: 54.7 minutes
-
Public transportation: 91.3 minutes
-
Workers with one-way commutes over 60 minutes: 35.3% (26.4% more than the national average)
-
Driving alone in car, truck, or van: 31%
-
Carpool: 49.6%
-
Public transportation: 89.6%
-
Workers 16 years and over: 40,381
-
Workers who drove a car, truck, or van: 29,959
-
Workers carpooling: 6,558
-
Workers taking public transportation: 1,190
-
Workers who commute outside their county of residence: 55.8%
-
Workers who commute outside their state of residence: 0.4%
1. Antioch, CA

-
Average one-way commute time to work: 45.4 minutes (72.0% higher than national average)
-
Driving alone in car, truck, or van: 41 minutes
-
Carpool: 49.7 minutes
-
Public transportation: 82.3 minutes
-
Workers with one-way commutes over 60 minutes: 33.5% (24.6% more than the national average)
-
Driving alone in car, truck, or van: 27.1%
-
Carpool: 39.1%
-
Public transportation: 85.8%
-
Workers 16 years and over: 47,238
-
Workers who drove a car, truck, or van: 32,427
-
Workers carpooling: 7,809
-
Workers taking public transportation: 3,643
-
Workers who commute outside their county of residence: 32.3%
-
Workers who commute outside their state of residence: 0.4%
Sponsored
Trade Smarter, Today
With CIBC Investor's Edge, kick-start your portfolio with 100 free trades and up to $4,500 cash back.